Earth Observation for Poverty (EO4Poverty)
Advanced deep-learning for the estimation of spatial wealth through Copernicus Sentinel data and sparse in-situ survey data.
The project aimed at implementing a novel and robust system based on advanced deep-learning to generate accurate spatial wealth maps by exploiting freely available EO data in combination with sparse in situ survey data. In particular, the goal was to improve existing approaches and to provide an easily transferable service for creating maps which can be employed as ready-to-use tool for policymakers.
Client
ESA
Partners
German Aerospace Center (DLR)
Navigation
Context
Poverty is one of the chronic problems of the XXI century and, despite the recent decrease of global economic inequalities, in 2016 about 800 million people still lived in extreme poverty condition. In this context, poverty alleviation programmes generally rely on data about local economic livelihood for identifying places with highest need for aid; nevertheless, this information traditionally comes from patchy, expensive and logistically challenging household surveys.
Given the issues of scaling up traditional data collection efforts, in the past few years alternative strategies have been proposed for estimating wealth – and in turn poverty – by means of satellite data. In this framework, some novel studies proposed the employment of very high resolution (VHR) satellite imagery coupled with (sparse) information extracted from in-situ wealth surveys. Nonetheless, despite promising, these still exhibit some critical drawbacks, the major being: i) the high cost of VHR data; ii) the very poor spatial resolution of the final spatial poverty maps (i.e., 10km); iii) the employment of NASA’s night-time-lights (NTL) as proxy for the economic activity, which generally leads to overestimation in bigger urban regions and underestimation in rural areas.
To overcome these limitations, ESA has funded the EO4Poverty project, led by the Swiss non-profit association MindEarth with the support of the German Aerospace Center (DLR) and the participation of the World Bank as end user. Indeed, a better understanding of the spatial distribution of wealth is fundamental for e.g. targeting the development of basic infrastructures or possibly understanding the main causes of the phenomenon. Among others, the main innovations of EO4Poverty with respect to the existing state-of-the-art approaches include: i) the use of open and free high resolution ESA Sentinel-2 imagery; ii) the design of an end-to-end deep learning-based system which directly estimates the local wealth (in contrast to complex existing transfer learning approaches where deep learning is used as feature extractor); iii) the production of wealth spatial distribution maps at unprecedented 100m spatial resolution.
The 8 countries chosen as case studies for experimental analysis.
Our approach
Extensive experimental analyses have been carried out for 8 countries, namely: Haiti, Malawi, Nepal, Nigeria, Rwanda, South Africa, Tanzania and Uganda.
The final system consists of 3 main components, namely the reference wealth information, the EO-based input data and the deep-learning architecture. In the project, reference wealth data collected from the Demographic and Health Surveys (DHS) have been considered. In particular, these include a wealth index ranging from 1 (low) to 5 (high), computed accounting for responses to questions about ownership of given durable goods and specific housing characteristics. Latest DHS surveys for the project target countries have been collected between 2014 and 2018. For privacy reasons, DHS data refer to clusters of surveys collected in the same site and are provided with a bias of 2/5 km for urban/rural survey locations. Accordingly, to properly account for this issue, in EO4Poverty circles of 2/5km radius have been first generated and centred over urban/rural survey locations. Then, after associating them with the DHS wealth index of the corresponding cluster, for each overlapping patch, the mean has been computed (along with the standard deviation and total number of observations).
Method
Two key datasets are provided as input to the implemented system, namely the human settlement composite index (HSCI) index and Sentinel-2 (S2) based temporal statistics.
Concerning S2, the basic idea is to gather all scenes collected over the country of interest in a 1-year timeframe and extract different temporal statistics for specific indices. This allows to effectively compress the information present in the whole multitemporal series. In particular, 2019 Level 2-A imagery has been considered (since wealth generally evolves slowly over time, the gap of 1 to 4 years with respect to the DHS reference surveys is reasonably not critical). Cloud, cloud-shadow, snow and ice have been masked by means of the Scene Classification Map provided along with each individual scene.
Afterwards, in addition to the original 10 bands acquired at 10 and 20m resolution, all possible normalized difference indices have been generated and for each of them the corresponding temporal minimum, maximum, mean, median and standard deviation have been computed. Furthermore, as simple but effective texture measures, for each temporal mean feature the corresponding spatial local mean and the coefficient of variation (given by the ratio between the spatial local standard deviation and local mean) have been calculated using a 5×5 pixel neighborhood. This led to a dataset consisting of 455 features. Out of these, Random Forest feature selection has been employed using the HSCI as reference to finally identify a subset of 17 features most suitable for characterizing the economic activity (and, in turn, wealth). The effectiveness of employing Sentinel-1 temporal statistics (alone or in combination with S2) has also been investigated; nevertheless, this did not provide any appreciable improvement.
Studies show that the combination with imperviousness information can reduce the saturation of the NTL in greater settlements as well as its typical diffusion effect in suburban areas. Moreover, in rural areas where scattered human settlements are hardly captured in the NTL layer, the presence of paved surfaces can be an effective indicator of the economic status. Accordingly, as more effective proxy of the economic activity the novel HSCI has been employed, which is jointly derived from NTL luminosity and both S2 based imperviousness and vegetation indexes.
As deep-learning architecture, a 3-layer convolutional encoder-decoder network has been chosen in the light of the excellent performances exhibited in several challenging applications. In particular, it consists of: i) an encoder network, which extracts from the given input a vector holding the only information (i.e., the features) meaningful to the specific addressed task; and ii) a decoder network, which takes the feature vector from the encoder and generates the closest match to the given reference. As trade-off between the computational load and the goal to generate high-resolution poverty maps, the target spatial resolution has been set to 100m (which allows to potentially characterize even intra-urban patterns of wealth) and the patch size to 84×84 pixels.
Additionally, given the spatial bias added to the in situ survey locations, it is reasonable to expect a higher reliability for training samples where more observations are available and their standard deviation is low. Hence, to properly take this into account, a dedicated weighted loss function has been defined which jointly considers both terms.
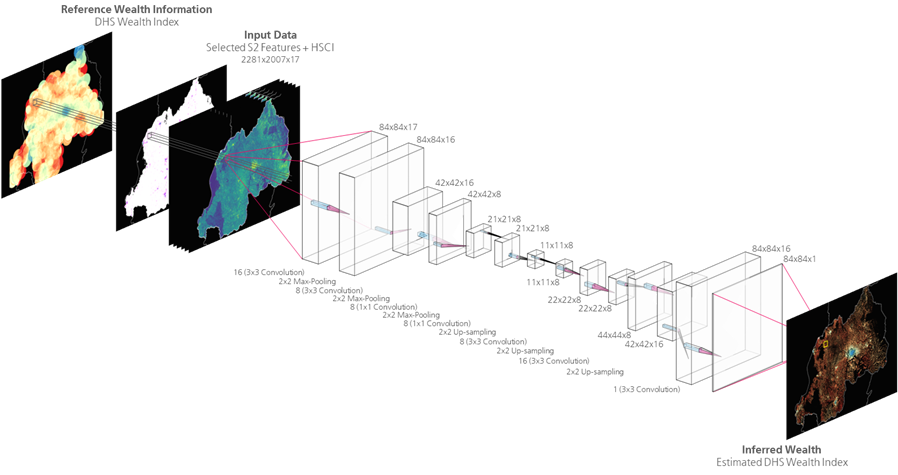
Block scheme of the implemented convolutional encoder-decoder network for generating high-resolution spatial wealth maps from S2-based features, HSCI index and reference DHS information.
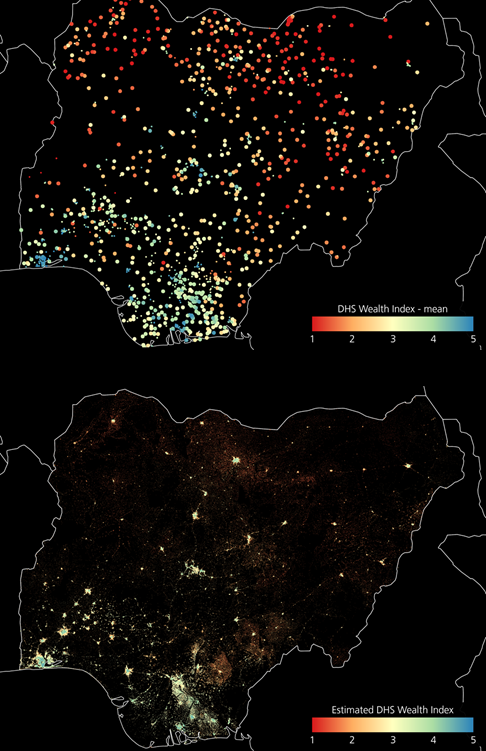
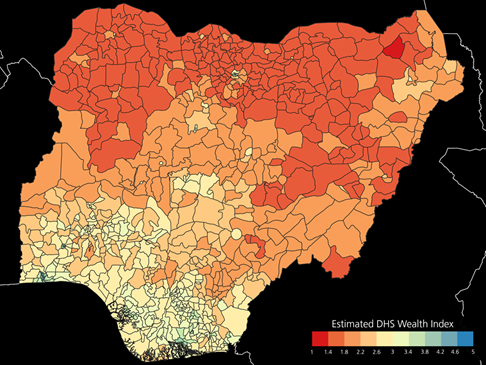
Nigeria: reference DHS wealth index mean (top) vs. estimated DHS wealth index at 100m resolution by the model exhibiting the highest R² (bottom).
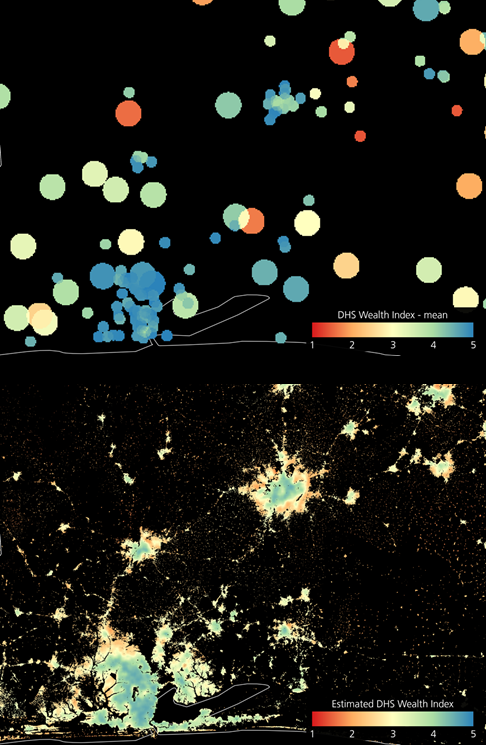
Lagos-Ibadan region: reference DHS wealth index mean (top) vs. estimated DHS wealth index at 100m resolution by the model exhibiting the highest R² (bottom).
Main results
All experimental trials have been performed within the IT4Innovation “Anselm cluster” in Czech Republic, to which access has been granted in the framework of the ESA Urban Thematic Exploitation Platform (U-TEP). For each target country 5 different models have been finally trained with different settings; moreover, the resulting 5 maps of estimated wealth index have also been combined using a linear average strategy. To quantitatively assess the performance of each model, 5-fold cross-validation has been applied and the average coefficient of determination (R²) has been calculated between the (spatially biased) reference DHS wealth index and the one estimated using the implemented approach. In this framework, recent key findings in the literature using the same DHS data suggest that the true (unobserved) performance of the models is actually higher than what the noisy test data suggest.
Given their similar behaviours, experiments can be grouped in 3 different subsets of countries: Group 1, which includes Rwanda, Haiti and Uganda and resulted in R² values higher than 0.8; Group 2, which includes Malawi and Nigeria and resulted in R² values in the range between 0.7 and 0.8; and Group 3, which includes South Africa, Tanzania and Nepal and resulted in R² values in the range between 0.6 and 0.7.
Countries belonging to Group 1 are characterized by the high number of surveys, whose spatial distribution also well covers the vast majority of settlement areas. Such a comprehensive training set is ideal for a proper learning of the system, which in turn results in very good performances.
Countries belonging to Group 2 are characterized by a consistent number of surveys, whose spatial distribution also well covers the vast majority of settlement areas, but are more representative of specific wealth index ranges. In this scenario, especially the inclusion of the HSCI index as input, as well as the employment of the weighted loss function proved particularly effective.
Results obtained for countries belonging to Group 3 let reasonably assume that the collection of the corresponding in situ data is not fully spatially representative and considerably biased towards poorer regions. This leads to underestimation of the wealth index in correspondence of the richer areas, specifically those characterized by the presence of 1-2 story individual modern houses surrounded by private gardens. Indeed, almost no survey has been collected in such neighborhoods, hence the system tends to associate these to low DHS wealth index given the similarity of their pattern in the satellite imagery to that of rural villages (for which a greater amount of surveys has been gathered).
Peeking in: the example of Nigeria
As an example, below we showcase the results obtained for Nigeria, whose reference DHS wealth index mean is reported in Fig. 2 (top). In particular, the map in Fig. 2 (bottom) depicts the estimated DHS wealth index obtained at 100m resolution with the implemented system by the model exhibiting the highest R². Moreover, Figure 3 zooms into the Lagos-Ibadan region (where more than 15 million people are currently living). Here, in the image at the bottom one can notice how the majority of the Lagos metropolitan area (lower left corner) is associated with wealth index greater than 4, but in correspondence of the northern outskirts (where the city is currently most rapidly developing) the value reasonably decreases even down to ~2.5. Similarly, Ibadan (in the middle) shows a city center with greater wealth index, but also in this case the system associates the suburban areas to values around 2, which seems correct since these host a number of informal settlements. The averages per NUTS1 and, especially, NUTS2 in Fig. 4 highlight the big differences between the northern poorest side of the country and the richer southern side. Additionally, it is interesting to notice that the only Local Government Area associated with extremely low wealth index (i.e., <1.4) is that of Gubio in the Borno State, which is hosting many camps for displaced people as a result of the protracted conflict in the region between the non-state armed group of Boko Haram and the Nigerian military.
Nigeria: reference DHS wealth index mean (top) vs. estimated DHS wealth index at 100m resolution by the model exhibiting the highest R² (bottom).
Lagos-Ibadan region: reference DHS wealth index mean (top) vs. estimated DHS wealth index at 100m resolution by the model exhibiting the highest R² (bottom).
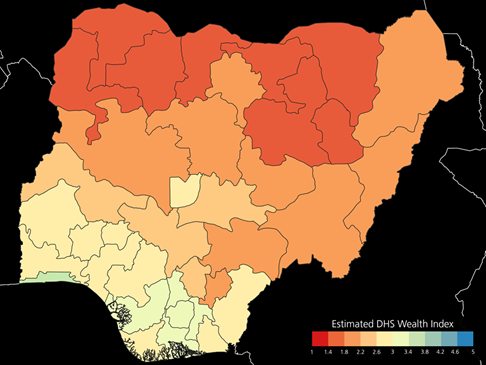
Nigeria: Average estimated DHS wealth index per NUTS1 (top) and NUTS2 (bottom) units obtained with the implemented system by the model exhibiting the highest R².
Conclusions
Overall, results obtained on the selected 8 target countries are extremely promising and assess the potential of the proposed approach to become a valuable alternative for complementing (spatially and/or temporally) the analyses carried out by national statistical offices (NSOs) purely based on household surveys. Indeed, these: i) require years to execute (typically 4); ii) are often collected for a limited amount of locations; and iii) generally have costs in the order of 1-2 million USD.
Furthermore, in the next future a number of potential follow-up activities are foreseen, among which: i) to test the models generated in the project for deriving wealth estimates in countries where no reference information is available; ii) to test the effectiveness of the proposed approach in spatially disaggregating variables alternative to the wealth (e.g., standard of living, housing quality); iv) to train the system with past EO-based and reference data and apply the resulting model to nowcast using current EO-based information for identifying if and where changes have occurred.
More projects of interest:
Population estimation, destroyed buildings, and land use classification
Mapping human behaviour before and after natural disasters using High-Frequency Location-Based data
Urban Digital Twin model for the visualisation, navigation and exploration of multiple information layers on cities in space and time.
Flood exposure and vulnerability mapping using street level image automatic acquisition and machine learning
An immersive A.I. Art experiment between poetry and photography for the Italian Pavilion at the XVII Venice Architecture Biennale.
A python library for the analysis of for High Frequency Mobility Data to support disaster response and infrastructural change