Disaster Resilience through Smartphone Location Data
Mapping human behaviour before and after natural disasters using High-Frequency Location-Based data
This project, carried out in collaboration with the GFDRR Innovation Lab, develops new methodologies for processing High Frequency Location Based (HFLB) data to measure and map human activities before and after natural disasters or major perturbations with impact on societies, and facilitate real-time resilience assessment and disaster response in vulnerable contexts and developing countries.
Client
World Bank’s Global Facility for Disaster Reduction and Recovery
Navigation
Context
The availability of digital data logging daily movements of individuals in space unlocks the possibility to characterize urban mobility patterns, including commuting habits and modal choice, as well as to study variations in activity and occupation of urban areas over time. In particular, mobile phone data such as Call Detail Records (CDR) and High-Frequency Location-Based data (HFLB) make it possible to accurately map socio-spatial interactions within the city boundaries during any given day.
Crucially, when combined with other types of data, HFLB data can substantially improve the precision of exposure mapping or disaster risk prevention and mitigation strategies, which are particularly important in vulnerable and populated areas of developing countries.
For this project, MindEarth partnered with World Bank’s Global Facility for Disaster Reduction and Recovery and employed anonymized GPS traces collected by multiple mobile applications to map the spatial behavior of Mexican citizens before, during and after the 2017 Puebla Earthquake. MindEarth developed a range of algorithms and spatial analysis tools to measure users’ characteristics, identify users with sufficient data coverage and detect changes in their behavior and displacement patterns that occurred as result of major events or perturbing factors.
Data and analysis methods
MindEarth obtained licensed de-identified and privacy-enhanced High-Frequency Location-Based (HFLB) data covering the Mexico State Area between 14th August 2017 and 1st August 2018. Each data entry consisted of a user identification string, a time stamp, and a GPS location. The total data consisted of 1.81 billion registered positions, with more than 1 million unique de-identified users who opted in to data collection for research purposes 1. With this rich dataset MindEarth’s analysts were able to accurately observe population mobility patterns. For example, by simply visualising the data of a typical day in Mexico City, it is possible to see the city literally “pulsing” with the daily rhythms of commuting (Figure 1).
To make this possible, MindEarth’s team leveraged on the open-source Python library mobilkit, previously developed by MindEarth in collaboration with the World Bank’s Global Facility for Disaster Reduction and Recovery and in partnership with Purdue University. For this project, we expanded the functionalities of the library to also include tools for measuring displacement (i.e. rate of people passing the night in a census area different from their home area), estimating fluctuations in occupation rates at specific locations and times, and revealing patterns of inequality and segregation.
Figure 1. Spatial distribution of the pings recorded between 1 am and 12 pm on two typical days in Mexico City. Urban traffic surges at around 7 am, followed by a period of calm and, later on, by a second peak of flows at the end of the working day.
- Note that some data providers, like Cuebiq, obfuscate/obscure/alter the coordinates of the points falling near the user’s home location in order to preserve privacy. This means that one cannot locate the precise home of a user with a spatial resolution higher than the one used to obfuscate these data. If one is interested in the census area (or geohash) of the user’s home alone or he is using a spatial tessellation wider than or equal to the one used to obfuscate the data, then this is of no concern. However, tasks such as stop-detection or POI visit rate computation may be affected by the noise added to data in the user’s home location area.
Main results
SOCIAL SEGREGATION
We measured segregation at district level, by comparing, for each census area, the fraction of iOS users over the total number of mobile devices in a typical hour. Indeed, the share of iOS users generally represents a good proxy to measure the wealth of a district, as iOS devices are mainly adopted by people falling in the middle-higher part of the income distribution.
At the municipality level (Figure 2, left) we detect a weak pattern of social segregation, with the north-west part of the city featuring a higher share of iOS users. However, if we repeat the analysis at the district level (Figure 2, right), more detailed patterns of segregation can be observed. Here, we can see that only some contiguous districts of each municipality (reported as black lines) feature a higher fraction of iOS users during the day, thus revealing a complex pattern of social segregation at fine spatial scales.
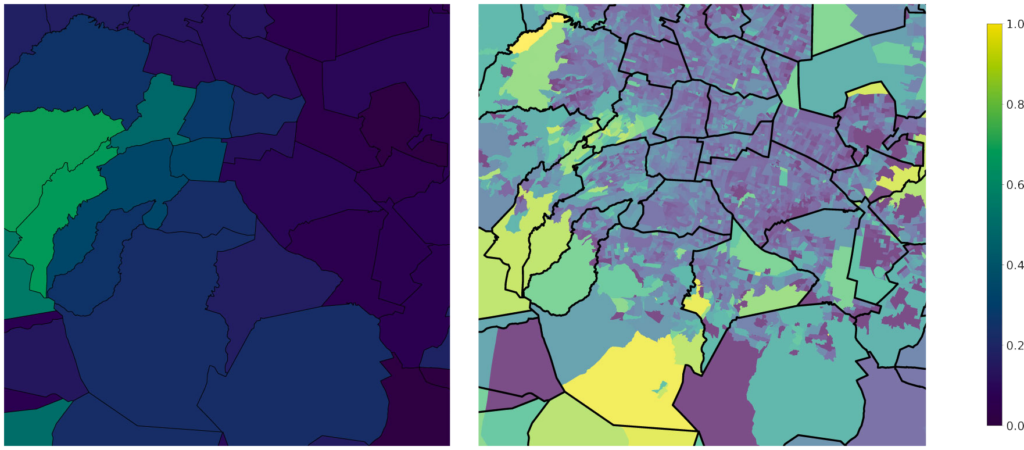
Figure 2. The spatial distribution of the iOS users prevalence (from blue- no iOS users- to yellow -only iOS users, the colormap is shown on the right) recorded in Mexico City at the municipality (left) and at the district level (right, municipalities are shown in thick black lines).
CHANGES IN AREA ACTIVITY
The data allows characterization of fluctuations in the density of users in a given area during certain periods. For example, we tracked changes in the relative number of people visiting a given area, allowing to assess number of visitors.
For example, we studied people’s movements during the ‘Dia de Muertos’, an annual Mexican festival taking place around 1st November, during which people visit cemeteries to celebrate their ancestors.
We focused on two types of areas in Mexico City: around transport hubs (airports, bus terminals etc.) and in neighbourhoods near large cemeteries (Figure 3).
After cancelling out seasonal and intra-day trends from the data, it is possible to spot relative changes in the density of users recorded in selected areas during the three weeks around the festival (Figure4).
Specifically, in the latter part of the week preceding the event (top panel) an increase in number of user visiting transport and cemetery areas is observed, due to people coming to town to celebrate the following week and people visiting cemeteries in preparation for the actual festival. During festival week, a clear increase of people visiting cemetery areas is observed (middle panel). Finally, activity in selected areas goes back to normal once the festival is over (bottom panel).
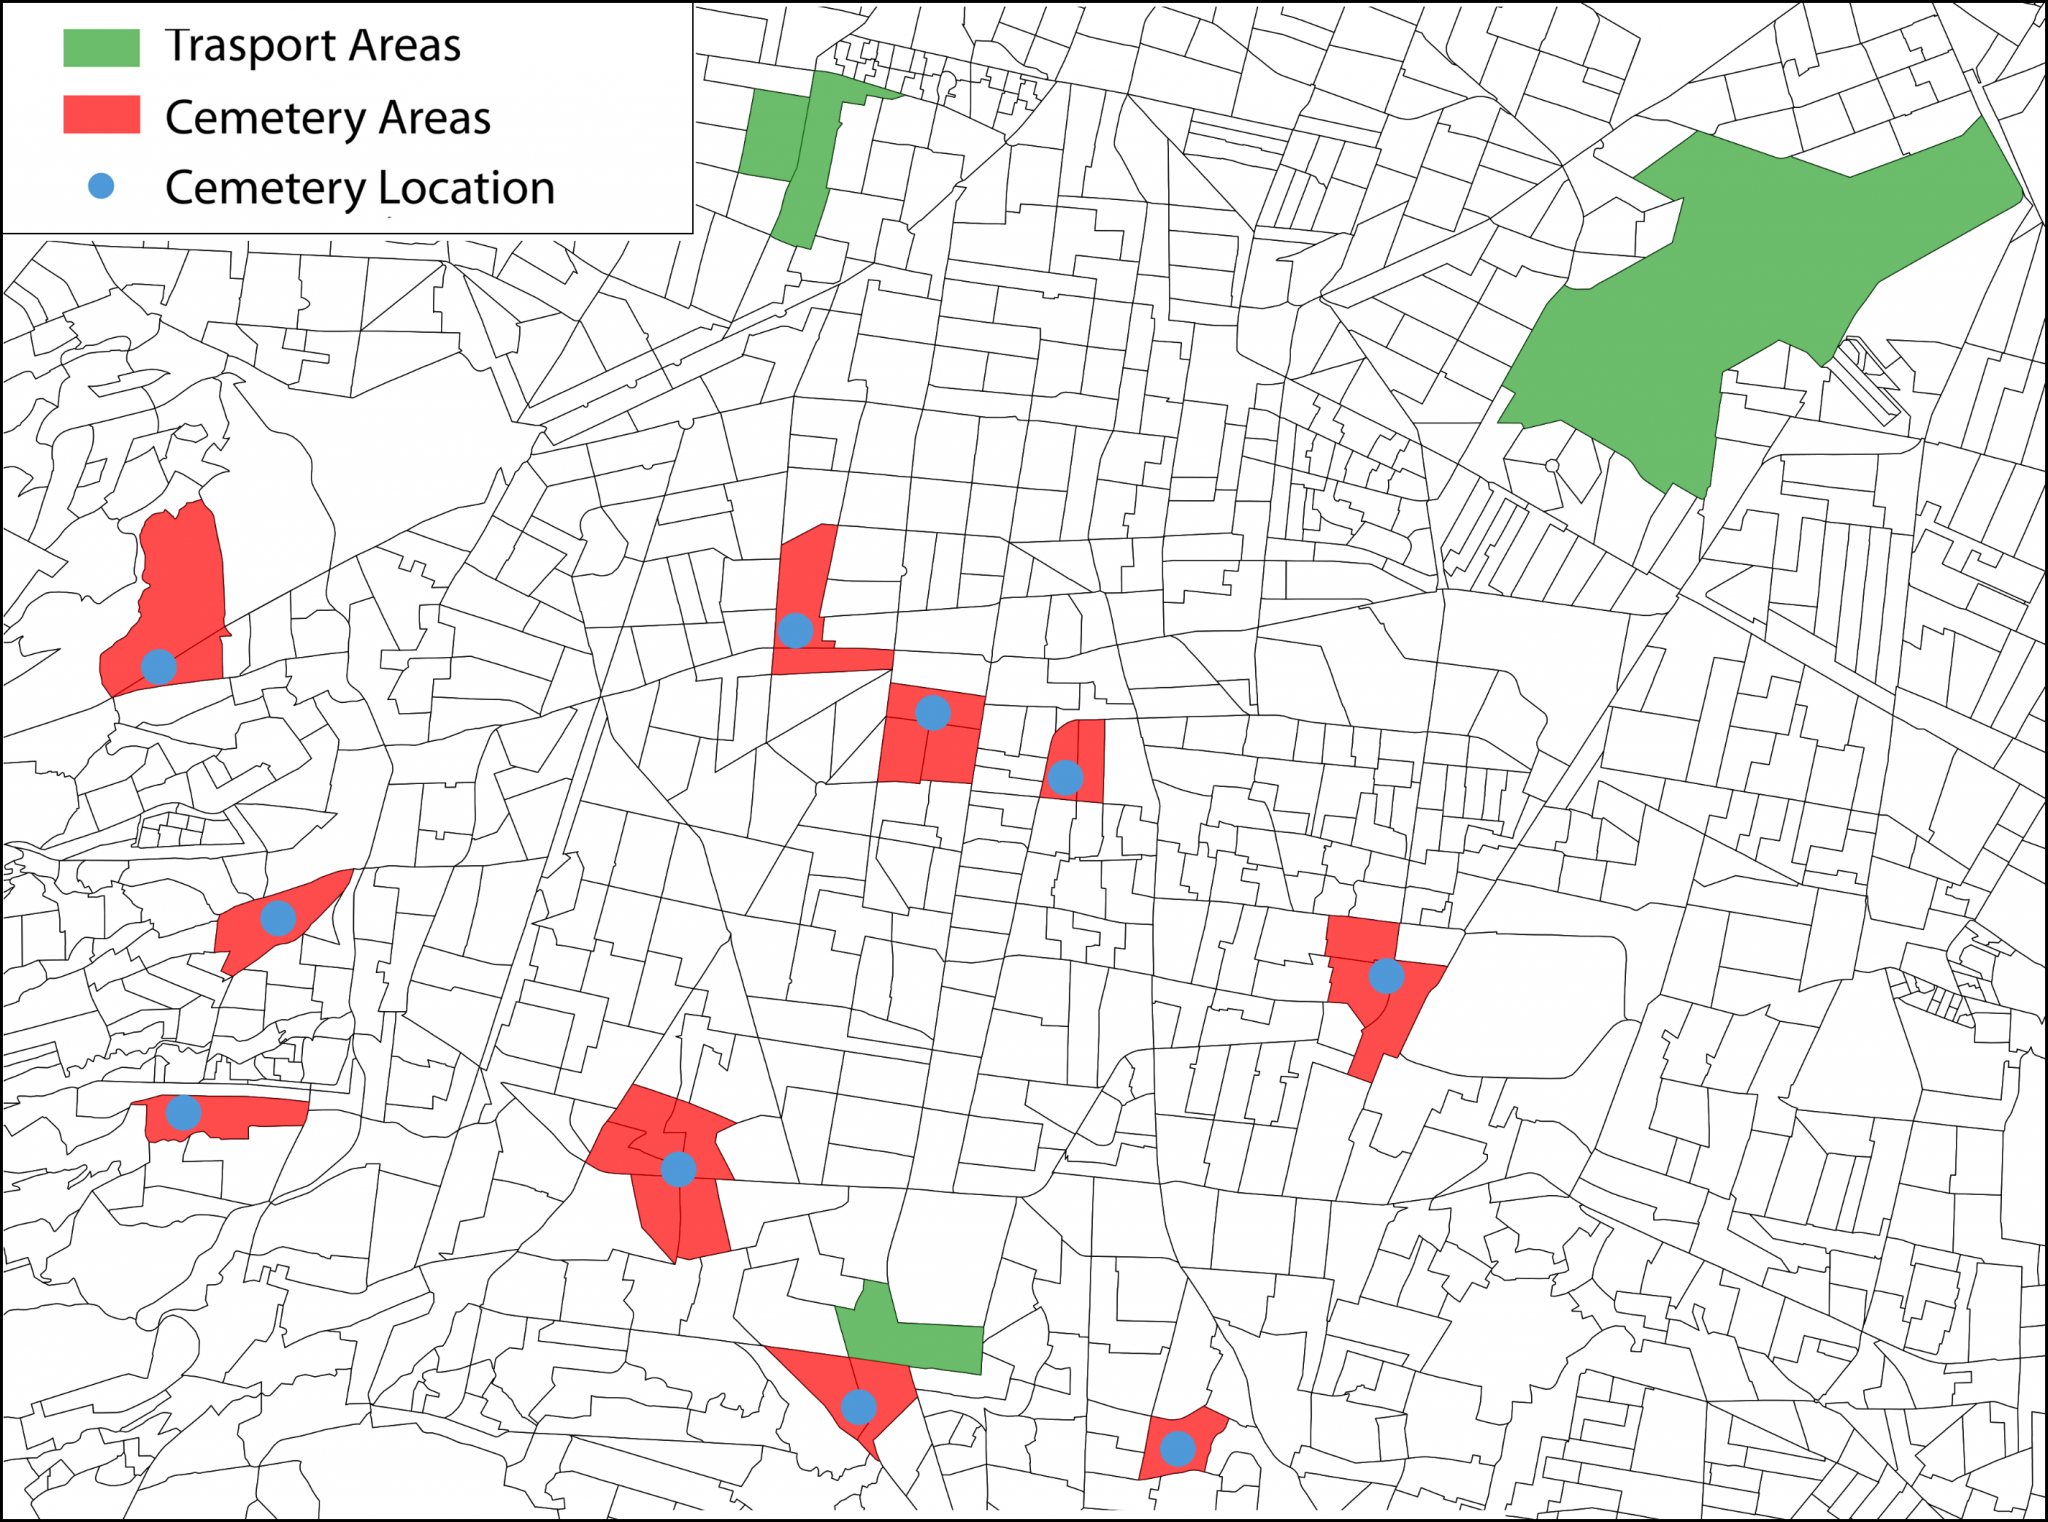
Figure 3. Transportation hubs (i.e., major bus stations and airport) are shown in green whereas neighbourhoods around main cemeteries (blue dots) are shown in red
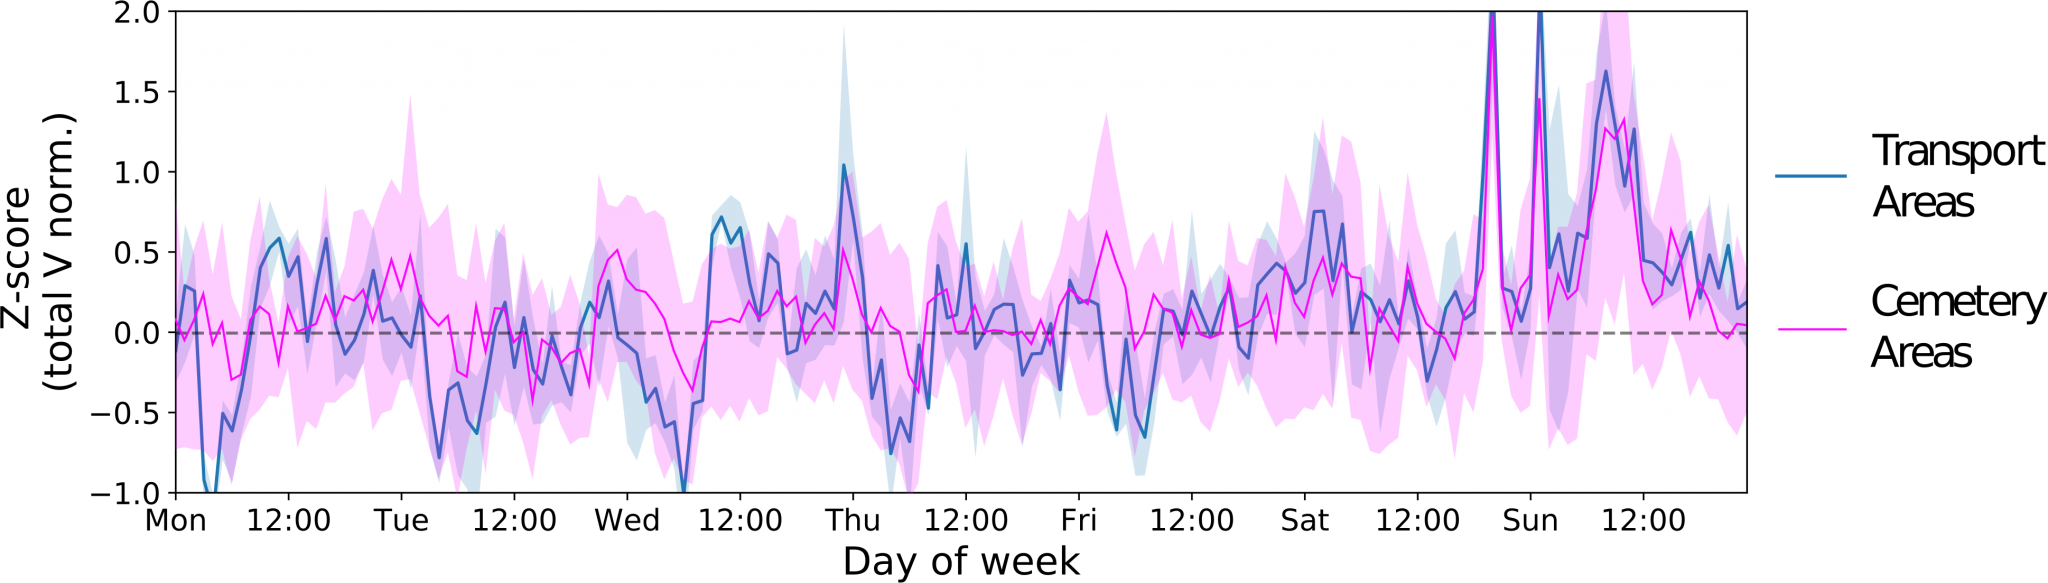
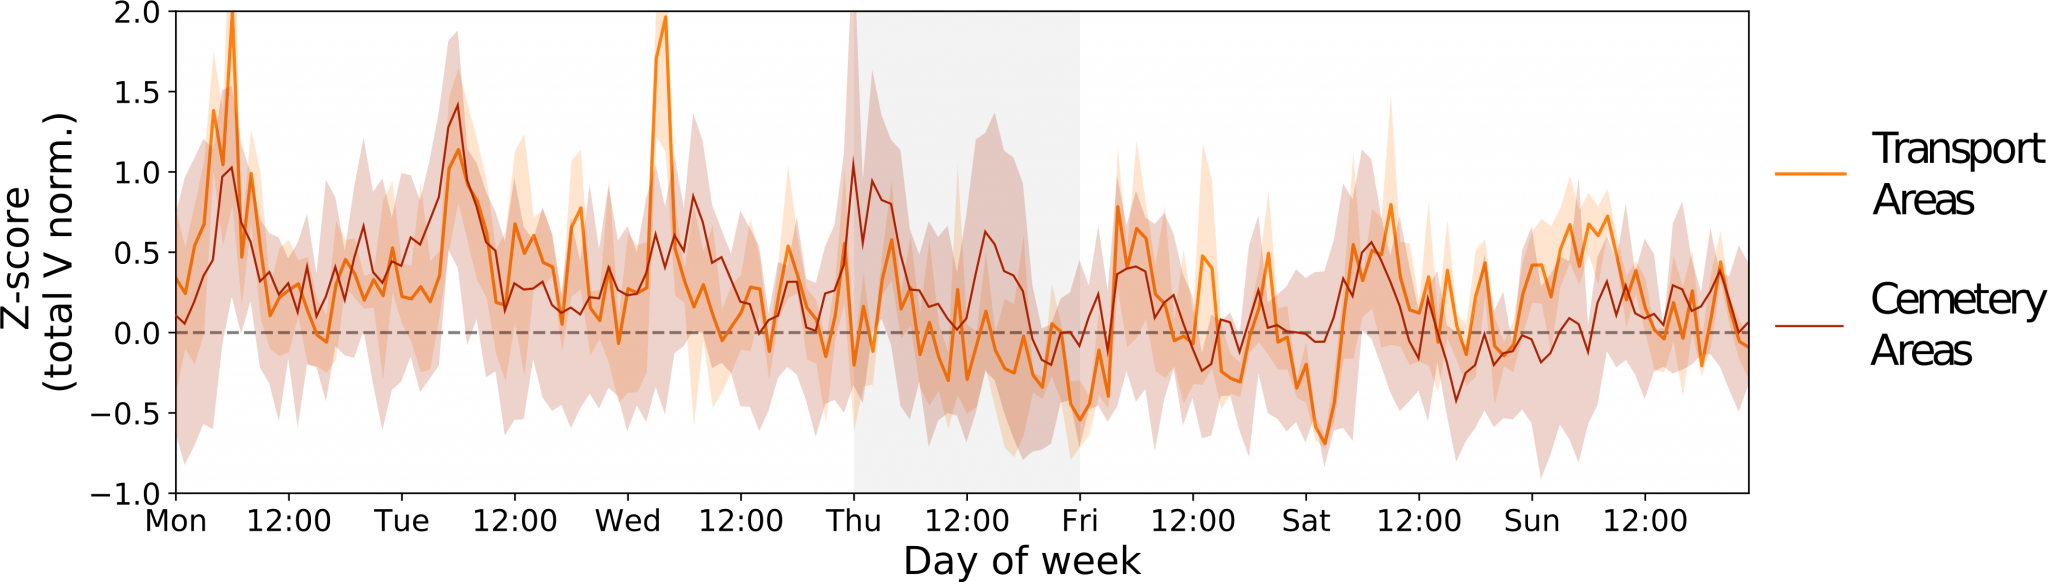
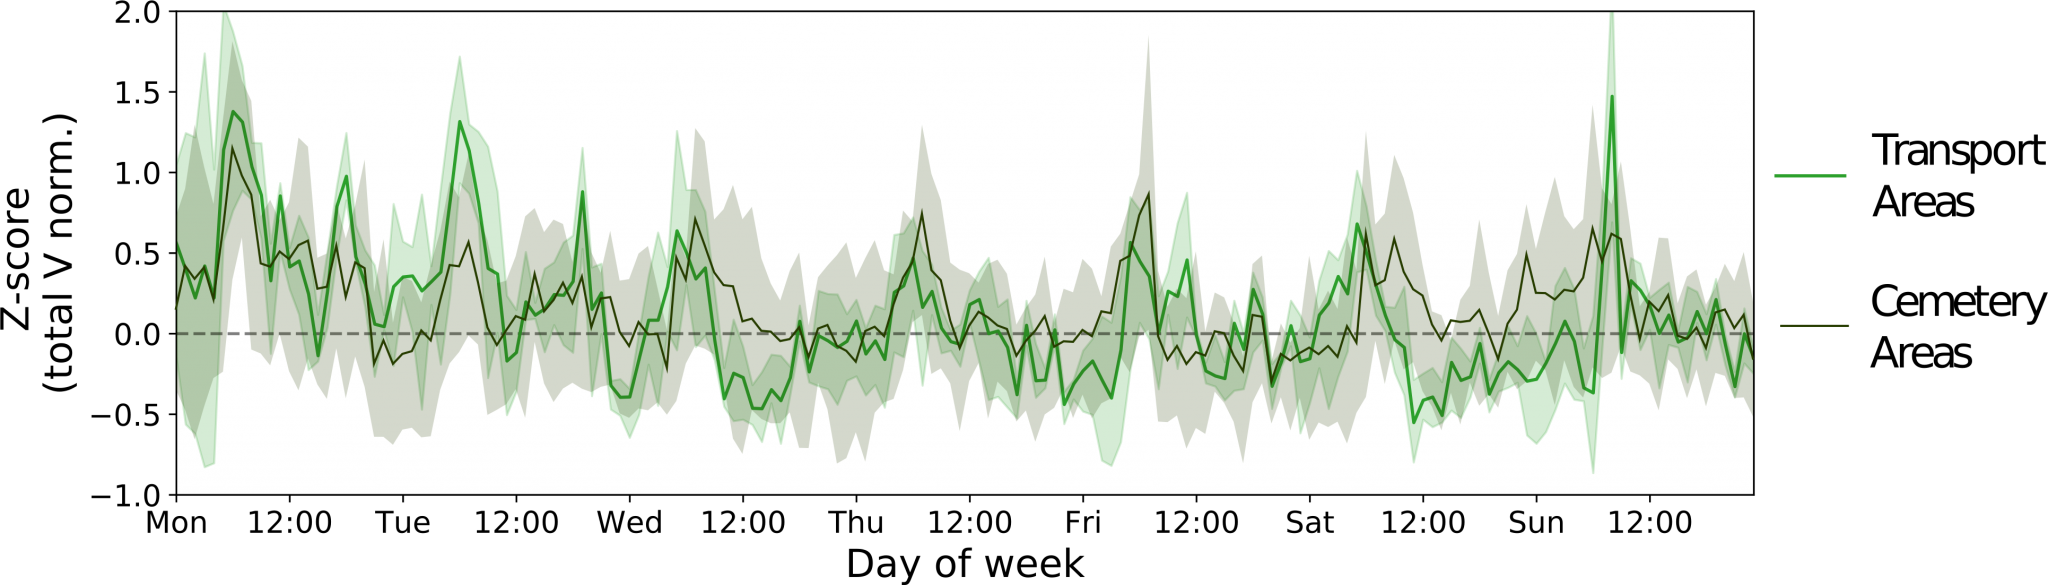
Figure 4. Normalized activities in the week before (top), during (middle) and after (bottom) the festival, revealing peaks of visitors at week-ends and pre-festival days. In the middle panel, we highlighted the day of the festival with a light-gray area.
DISPLACEMENT AFTER EXTREME EVENTS
Finally, we used HFLB data for the analysis of displacement after the Puebla earthquake on 19th September 2017. To this end, the mobilkit library was enhanced to dynamically determine people’s home census area. This is assigned by looking at the census area where each user spent most of its night-time in the weeks up to 12th September 2017.
In this way, a user spending the night in a census area different from its home area in the following days can be said to be “displaced”. Next, we wanted to compare displacement rates after the earthquakes in different census areas.
We divided these into five groups progressively more distant from the earthquake’s epicentre and measured the displacement rate for each area. As expected, we found that displacement rate in regions close to the epicentre was considerably higher than other areas of Mexico City (Figure 5).
We then used the library to assess the average displacement of all the areas falling in each distance bin (Figure 6) and observed a sudden increase of the displacement rate in the region closest to the epicentre, followed by a recovery to the initial level of displaced people.
Displacement Bin and Displacement Regions
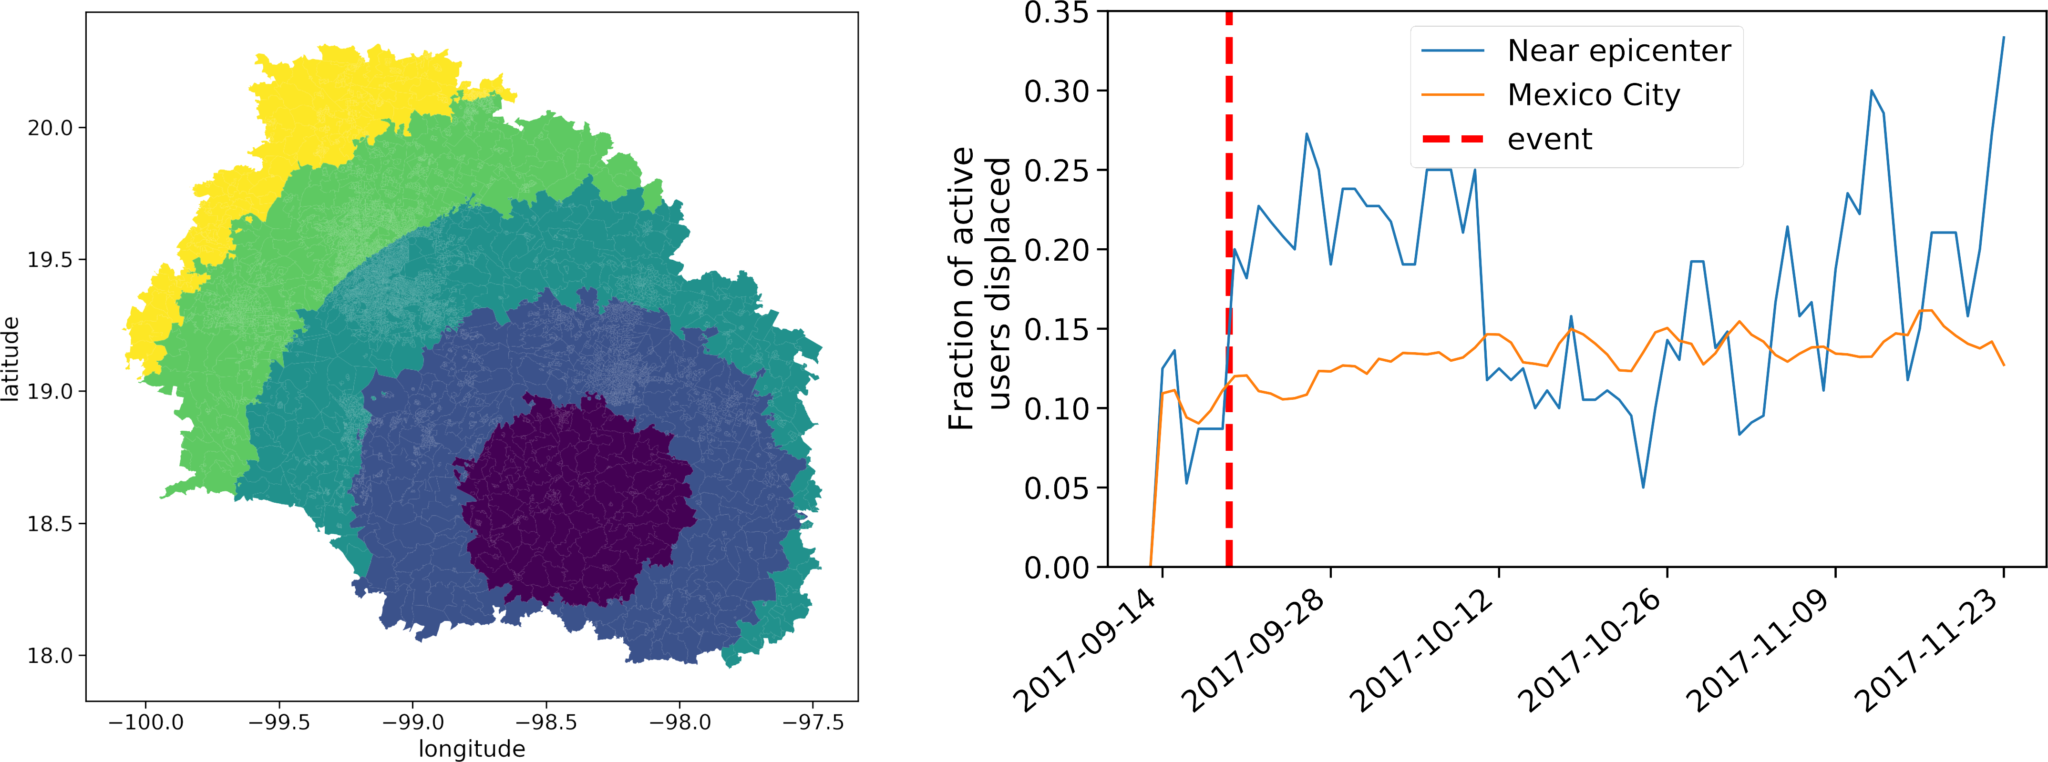
Figure 5. Implemented distance bins from the earthquake’s epicenter and comparison of the displacement rate in Mexico City and regions around the epicenter.
Displacement rate
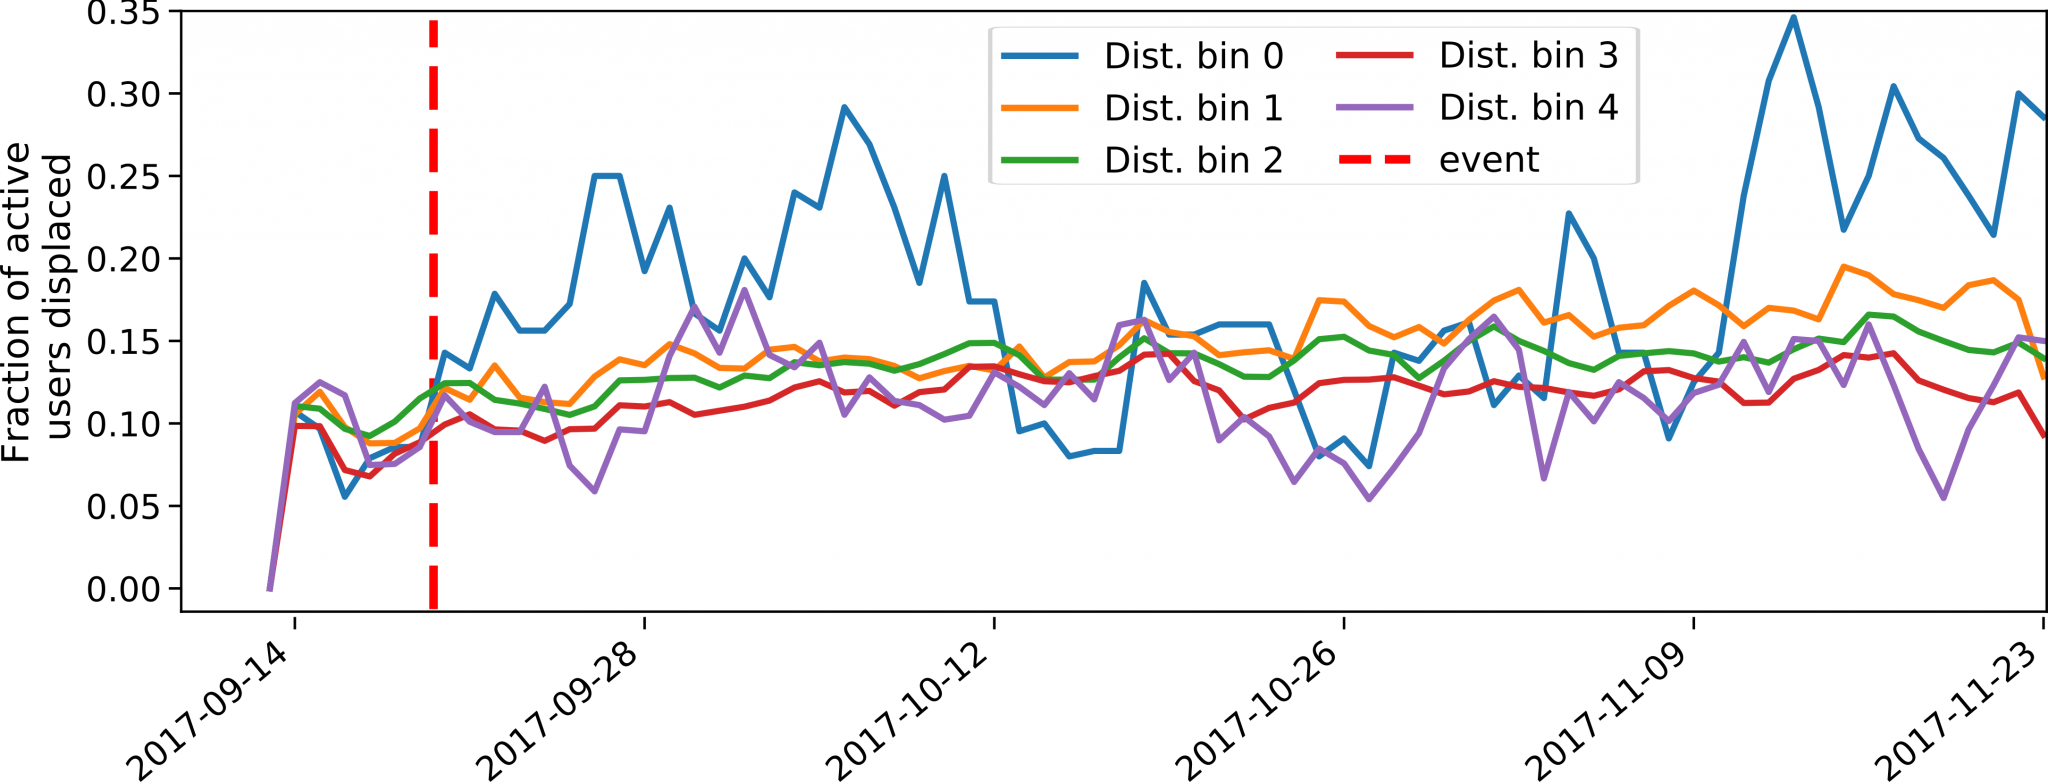
Figure 6. The displacement rate as measured in the 5 bins shown in the first panel. The closer bin (bin 0, blue line) features a higher response with respect to the others.
We repeated this analysis by grouping areas by the seismic intensity during the earthquake (figure 7). In both cases, we found that the further an area is from the epicentre, the weaker the increase in displacement and that the most affected areas featured a higher displacement rate compared to the weakly affected ones. Since mobilkit allows to extend the analysis with external data, we also checked whether the wealth index of an area correlates with the propensity for its inhabitants to be displaced after the earthquake.
As we show in Figure 8, there is a negative correlation between the poverty index of an area and the fraction of people displaced.
This finding indicates the existence of inequalities in post-disaster population response. Specifically, it shows that poorer communities are less likely to move out of disaster-affected areas than wealthier communities.
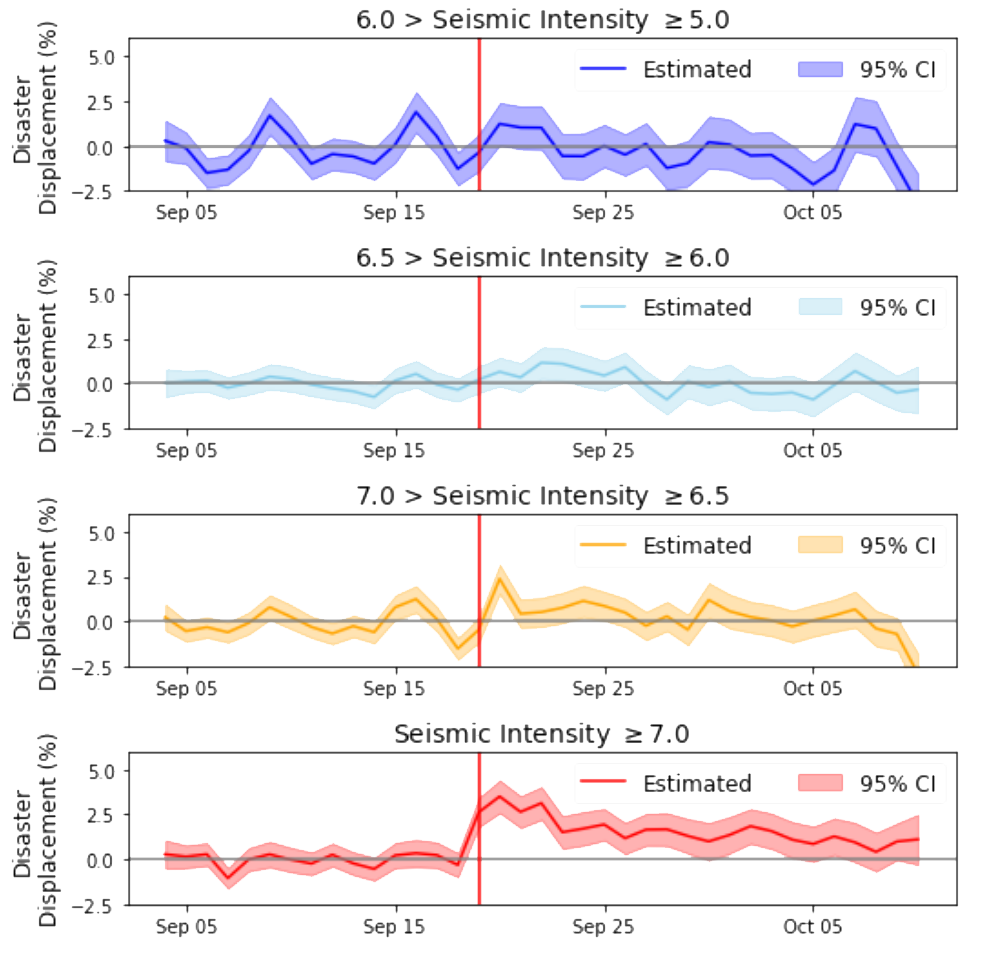
Figure 7. The displacement rate computed on areas grouped by different levels of seismic intensity.
Displacement vs Wealth
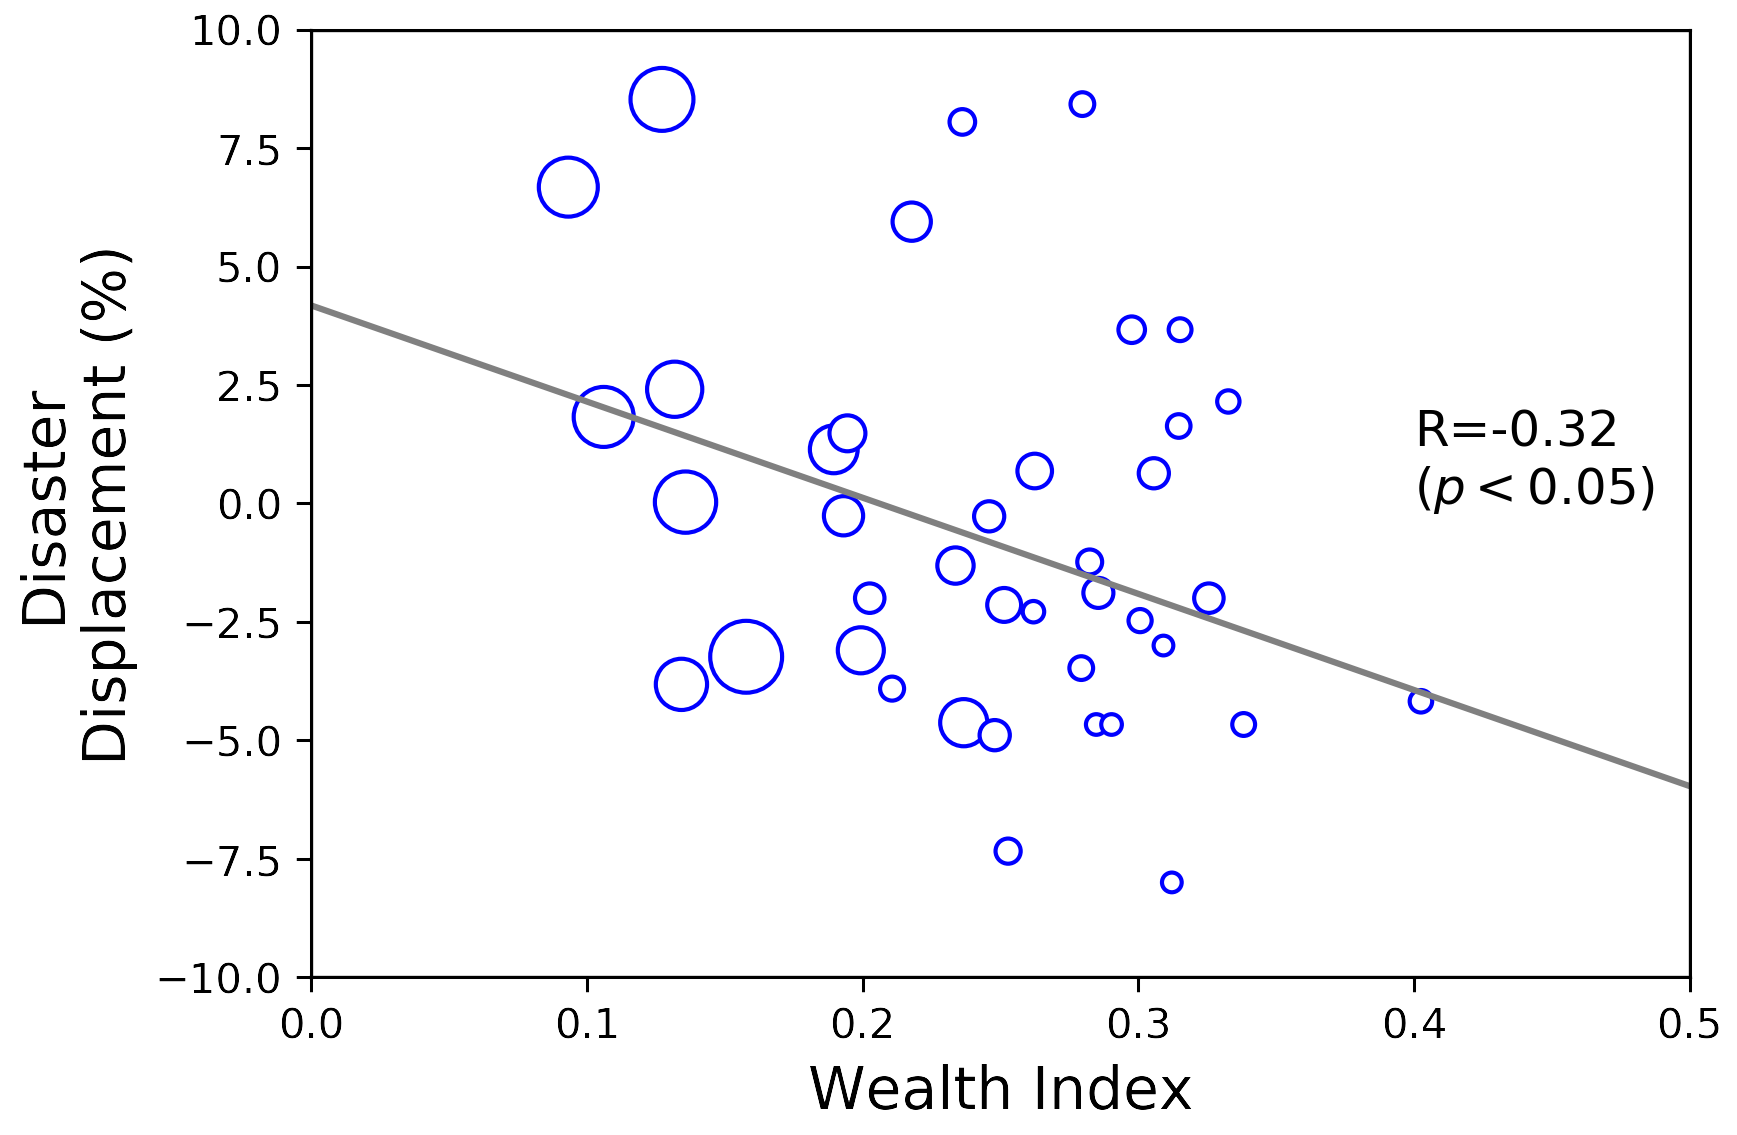
Figure 8: Correlation between the poverty index and displacement rates at the municipality level. A negative and significant correlation suggests that poorer users had a lower tendency of being displaced from the affected areas. The size of each symbol represents the sample size for each municipality
Conclusions
Thanks to the rapidly expanding fraction of the population owning GPS enabled smartphones, real-time HFLB data represent a fundamental tool to assess and measure mobility habits, response to extreme events and social segregation at a fraction of the cost of regular surveys and with a larger population coverage. This wealth of longitudinal data allows to detect and measure shifts in the mobility habits of a population at an unprecedented level of spatial and temporal accuracy. When coupled with socio-economic indicators, HFLB mobility data can be crucial to rapidly measure population response to extreme shocks on large scales, as well as to measure patterns of displacement and social segregation. In addition, this kind of information can be used to highlight common activity profiles in relation to specific timeframes or in response to major programmed events.
In this work, we performed all of these tasks using the open-source mobilkit library. The latter has proven extremely powerful to capture human mobility patterns in response to external perturbations in large geographical areas. In particular, we measured i) the spatial patterns of segregation, ii) shifts in the visit rate to Points Of Interest (POIs) during major social events, and, iii) how socio-economic and spatial factors influenced the displacement of people after a major natural event.
Currently, the collaboration between MindEarth and the Global Facility for Disaster Reduction and Recovery is still ongoing. The team is currently developing new machine learning and high-performance data-analysis pipelines for the analysis of population’s mobility patterns and to hamper the inherent biases that these data may introduce in the analyses, due to different adoption levels of the technology in different parts of the region under analysis.
If you want to know more about mobilkit you can visit the related post. A technical paper presenting the library can be found here, while you can find all the details to install and use the library can be found on GitHub, readthedocs or pypi. A detailed paper on the case study of Mexico can be found here.
More projects of interest:
Mapping the relationship between urbanization and exposure to flood at a global scale between 1985 and 2015
Population estimation, destroyed buildings, and land use classification
A python library for the analysis of for High Frequency Mobility Data to support disaster response and infrastructural change
Advanced deep-learning for the estimation of spatial wealth through Copernicus Sentinel data and sparse in-situ survey data.
Flood exposure and vulnerability mapping using street level image automatic acquisition and machine learning
An immersive A.I. Art experiment between poetry and photography for the Italian Pavilion at the XVII Venice Architecture Biennale.