Global tracking of flood risk exposure in urban areas
Mapping the relationship between urbanization and exposure to flood at a global scale between 1985 and 2015
For this project MindEarth was asked to analyse and link, at a global scale, spatial patterns of urbanization and flood risk exposure. The goal of the project was twofold: on the one hand, to better understand to what extent urbanization has occurred in high flood risk zones in the past and, on the other hand, to evaluate potential flooding risks associated with new urban development.
Context
Our world is becoming increasingly urban. Cities are growing both in population and spatial extent – a trend that is particularly strong in developing countries. And as this process unfolds, an increasing amount of new development is taking place in areas of environmental risk – such as riverbeds, floodplains or wetlands. And those who will and are already paying the human and economic price for this increased exposure to risk are, disproportionately, the poorest and most vulnerable segments of the population.
Flooding is one of the most common and damaging extreme weather events globally, severely impacting cities due to the high concentration of people, anthropic infrastructure and economic assets. To reduce the level of risk and minimise exposure, reliable spatial information is needed to accurately relate flood hazard to spatial patterns of urban development and to effectively support urban planning and environmental risk management strategies. To address this complex challenge, the World Bank commissioned MindEarth to conduct a systematic analysis of spatial patterns of urbanisation in relation to flood risk exposure on a global scale. More specifically, our team was tasked with estimating, for each country, the share of new urbanisation occurring in areas of high flood risk, looking at both the risk associated with new urban development and historical urban footprints. The project led to the creation of a global urban flood exposure map covering the entire world surface both in the present and in time, year by year, since 1985.
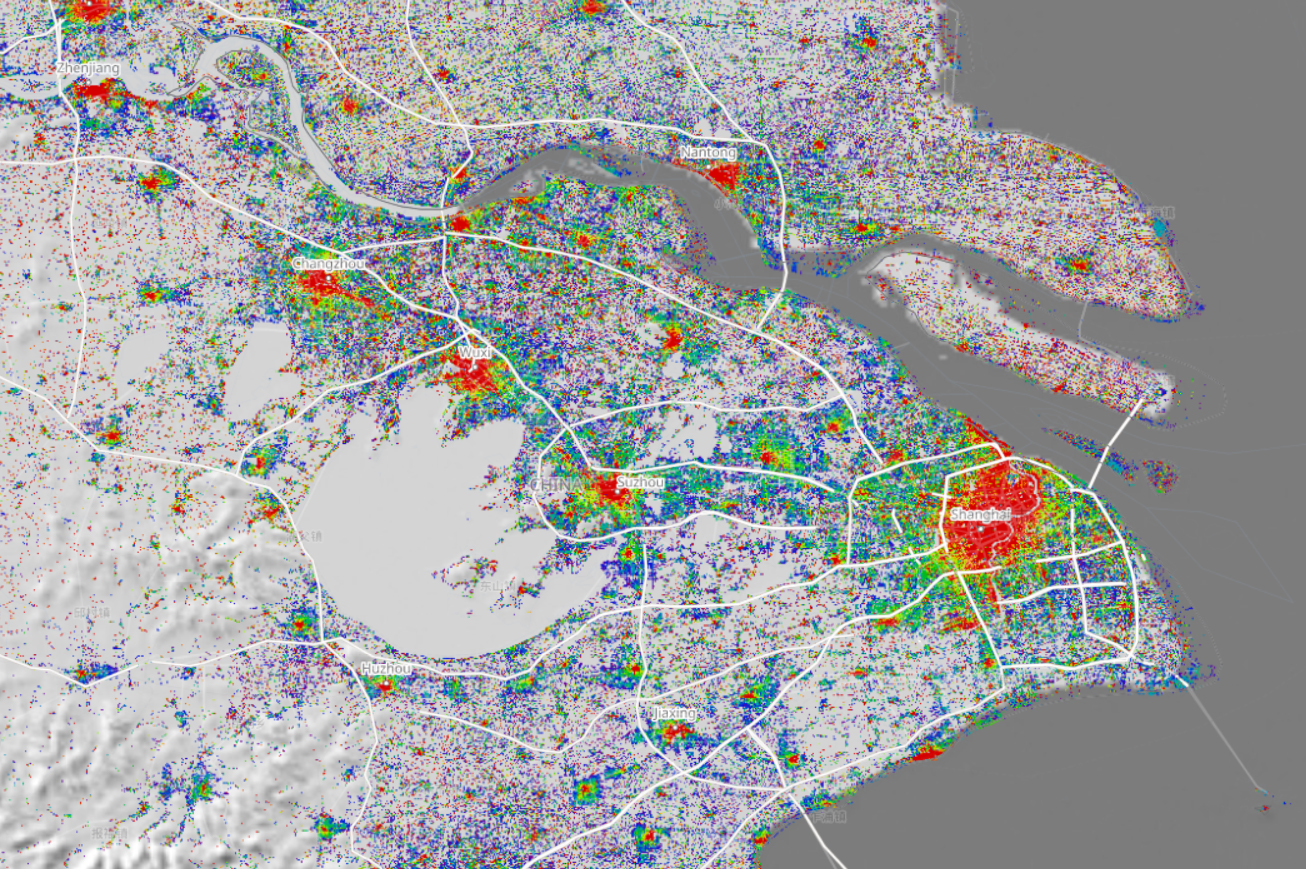
Figure 1: Excerpt of the World Settlement Footprint (WSF) Evolution over Shanghai.
The input data
Building a global map tracking flooding risk over time required reliable and accurate urbanisation and flood risk data covering entire world consistently over an extended period of time – year by year. To this end, MindEarth employed three main datasets:
Fathom pluvial flood hazard map: information on flood extents and depths at a 3-arcsecond resolution (~90 meters at the equator) for 100-year return period events where surface water builds up beyond the absorptive capacity of soil during heavy rains.
Fathom fluvial undefended flood hazard map: information on flood extents and depths at a 3-arcsecond resolution (~90 meters at the equator) for 100-year return period events where intense or excessive precipitation or snowmelt cause rivers to overflow.
JRC coastal flood hazard map: 1 information on flood extents and depths at a 3-arcsecond resolution (~90 meters at the equator) for 100-year return period events due to tidal or storm surges, or sea level rise.
- the World Settlement Footprint Evolution (WSF-EVO) dataset, developed by the German Aerospace Centre (DLR) and outlining the growth of settlement extent globally at 30m spatial resolution and high temporal frequency from 1985 to 2015, derived by means of multitemporal Landsat-5 and Landsat-7 imagery.
Finally Administrative Level 0 (ADM0) and Level 1 (ADM1) boundaries as well as additional boundaries capturing regional units and income groups were used as reference to aggregate and further characterise results.
Our approach
After pre-processing input data, the analysis was performed in three main steps. The first step was calculating of zonal statistics at ADM1 level to produce four different flood hazard maps, namely Pluvial 1 in 100, Fluvial Undefended 1 in 100, Coastal 1 in 100, Max Hazard 1 in 100, for each year and considering 5 different floodwater depth intervals of interest. To this purpose, a dedicated JavaScript has been implemented in the Google Earth Engine (GEE) platform, that iteratively masks the flood hazard maps by solely preserving those pixels that belong to the given class under analysis and are marked as settlement in the WSF evolution layer for the specific target year. Figure 2 shows a typical output for the area of Bangkok (Thailand).
The second step was the employment of a shape prescriptive modelling to overcome possible drawbacks due to settlement over- or under-estimation, mostly due to the limited number of satellite scenes collected in certain world regions before the year 2000.
For this task, MindEarth’s team employed a cutting-edge regression approach which allows to model the temporal profile of the settlement extent while accounting for the data availability specific to the region under investigation. In this way, for each year and region, it was possible to characterize the overall goodness of the available Landsat imagery.
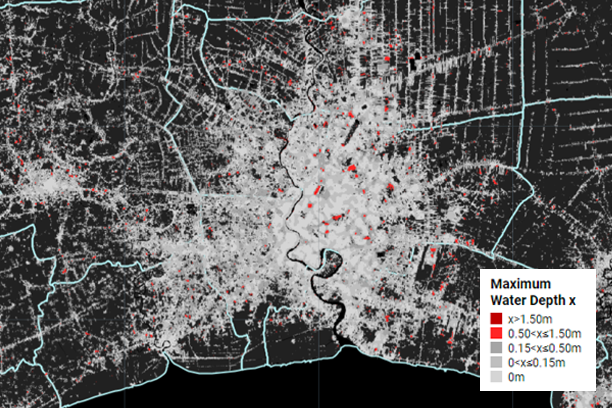
Pluvial 1 in 100 years
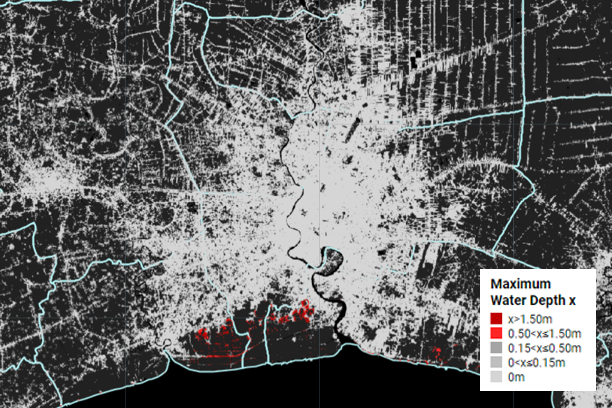
Coastal 1 in 100 years
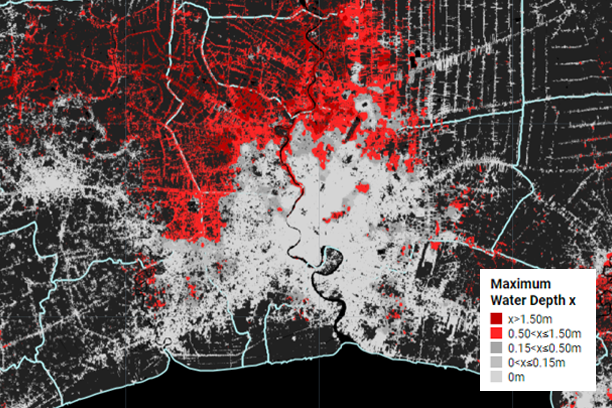
Fluvial 1 in 100 years
Maximum 1 in 100 years
Figure 2: Bangkok (Thailand) – 2015 spatial distribution of settlements over the 5 selected floodwater depth classes for the different flood hazard maps investigated.
The third and final step was the aggregation and computation of a number of indicators meant to comprehensively characterise urbanisation in flood prone areas. After performing a zonal sum for each ADM1 region to obtain the total yearly settlement area (in km2) therein contained in each year, six target indicators were calculated, namely:
- Settlement Extent Percent Yearly Growth Rate, representing the percent growth with respect to the previous year;
- Settlement Extent Percent Growth 1985-2015, representing the percent growth with respect to 1985;
- Settlement Extent Percent Share, representing the percent share of the total settlement extent;
- Settlement Extent Yearly Percent Share Growth Rate, representing the yearly growth rate of the percent share above;
- Settlement Extent Percent Share Change 1985-2015, representing the change of the percent share above with respect to 1985;
- Yearly New Settlement Extent Percent Share, representing yearly the percent share of the only new settlement extent areas.
These were computed for each flood depth target interval at ADM1 level, and further aggregated at World and ADM0 level, as well as per regional unit and income group, in line with the political borders and territories as recognized by the World Bank. Figure 3 shows results for 4 of the 6 indicators for the 4 flood hazard maps at global scale.
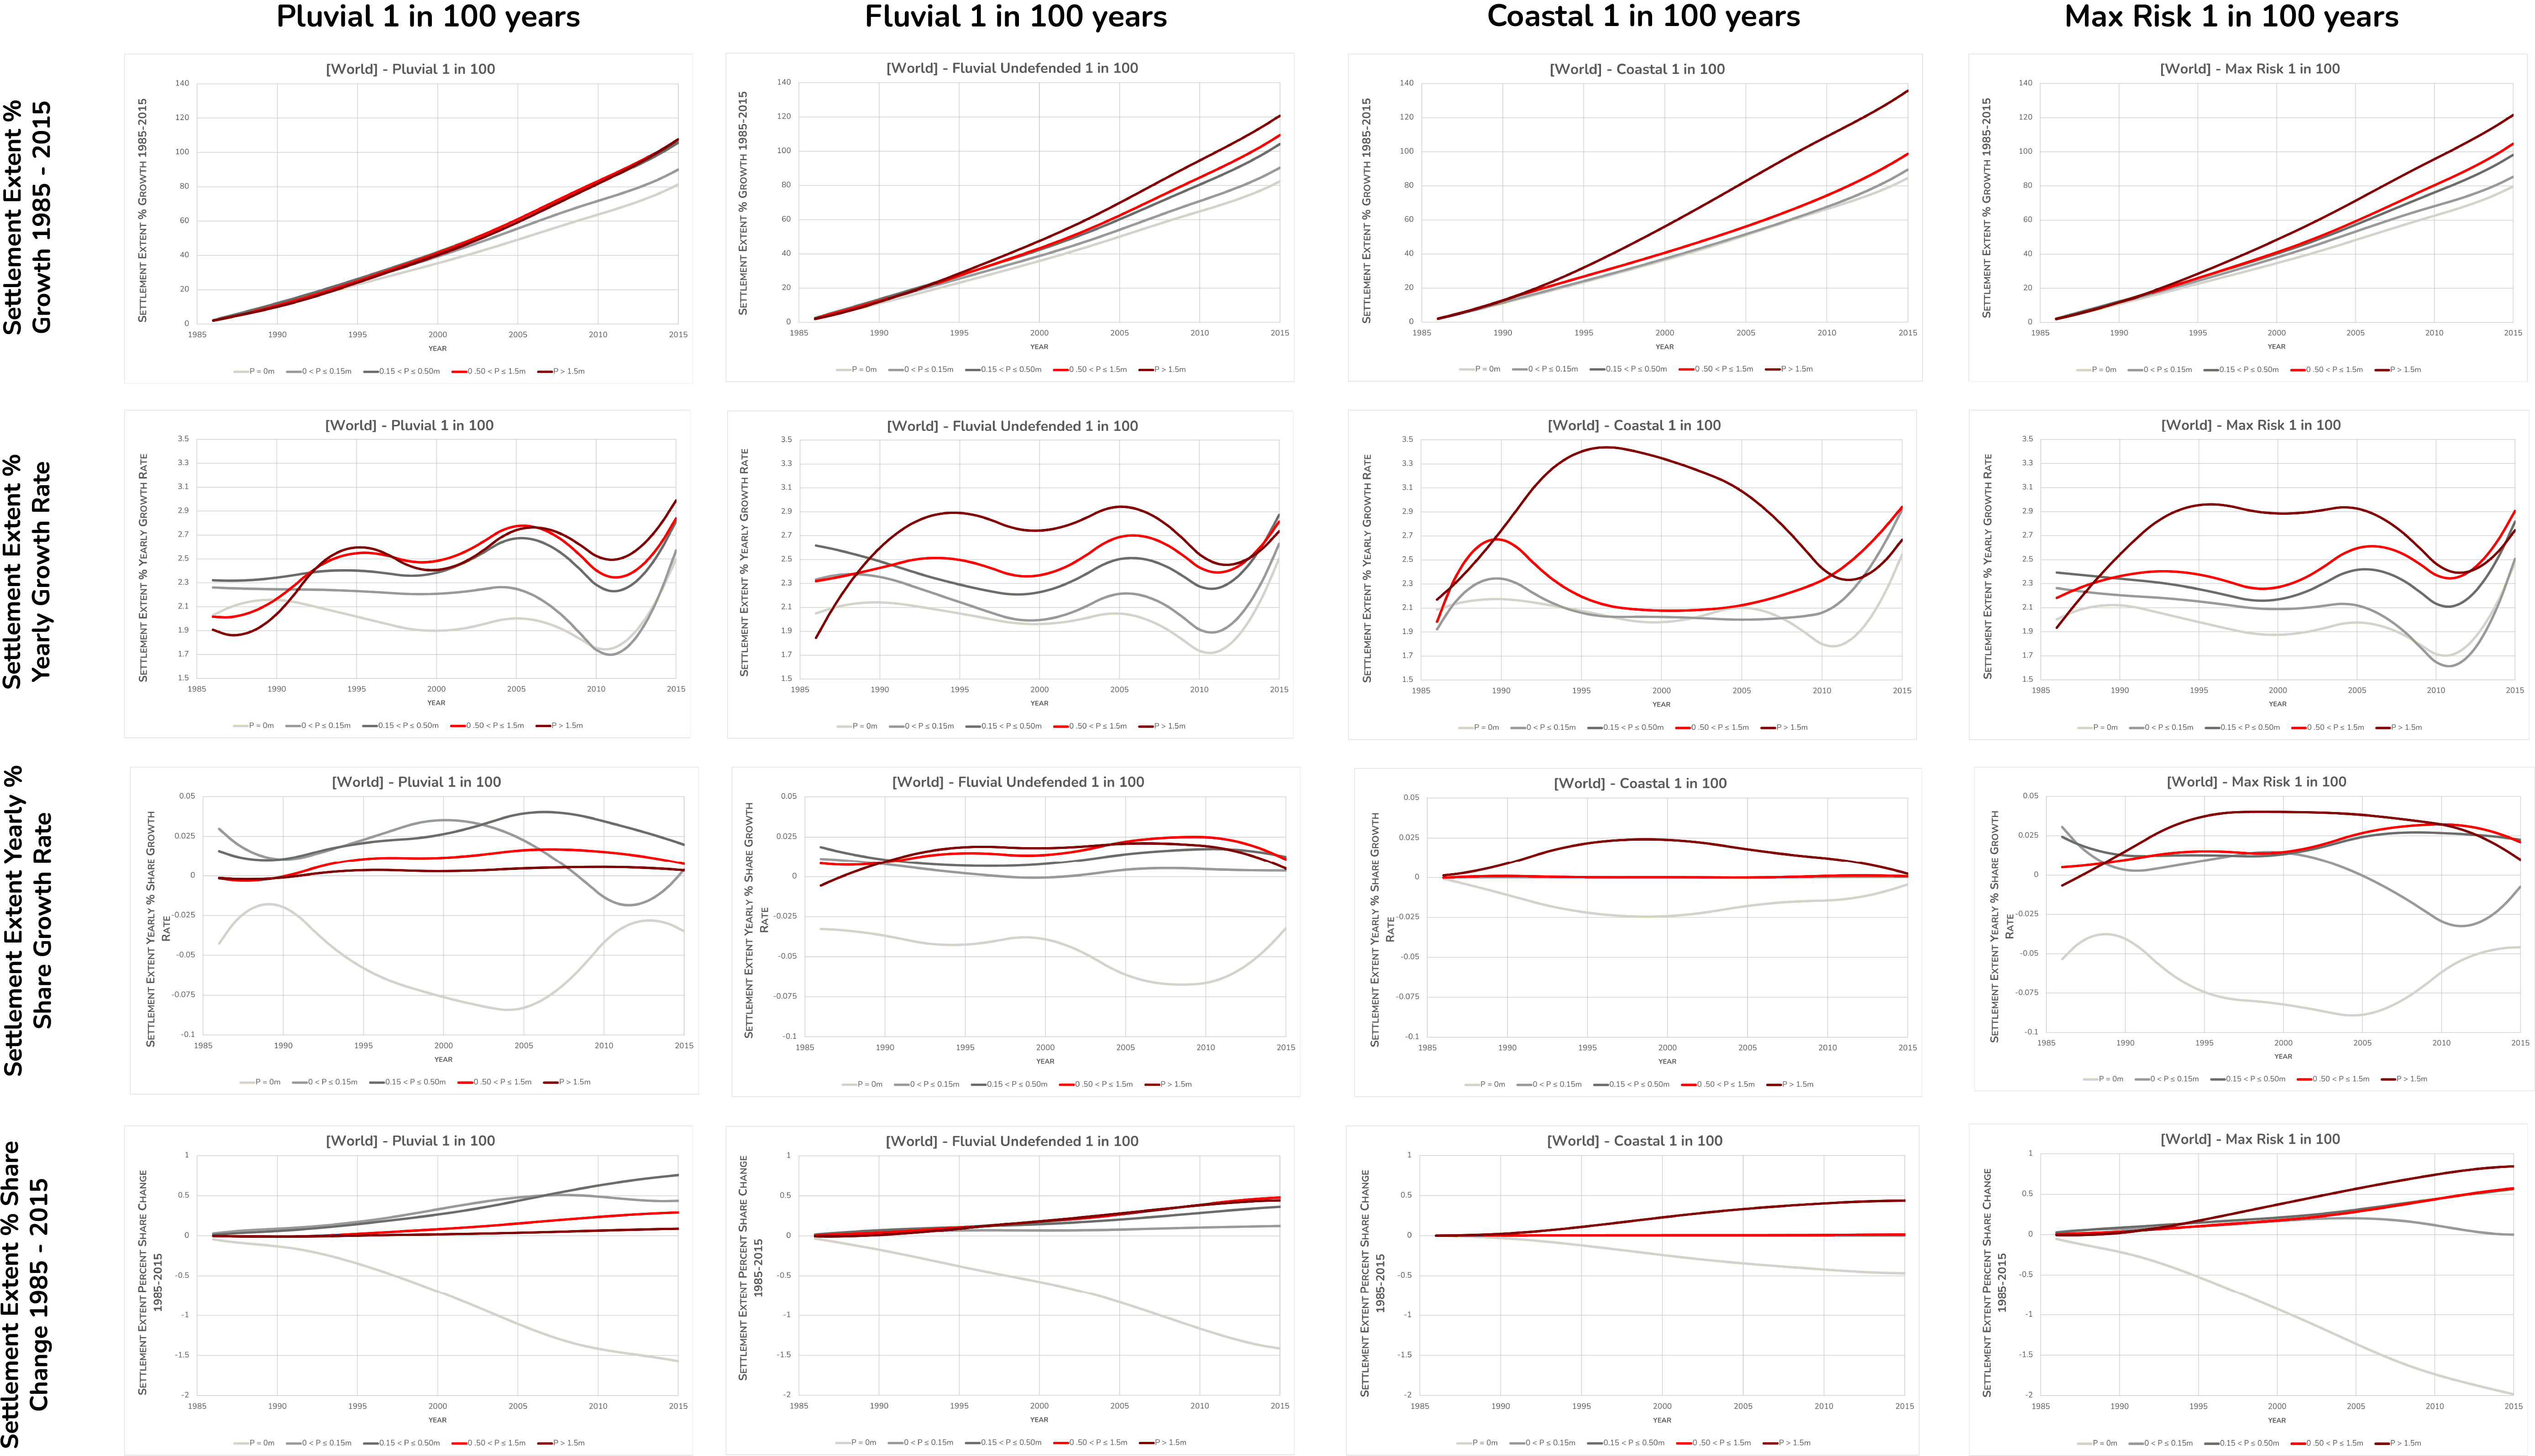
Figure 3: Flood risk exposure (pluvial 1:100, fluvial 1:100, coastal 1:100 and max risk 1:100) at global scale in relation to four of the six selected target indicators.
Main Results
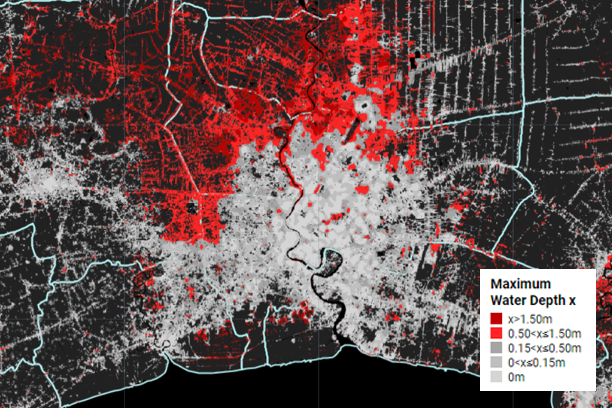
Over the last few decades, urban growth has been particularly fast in high-risk flood zones. Indeed, while the global extent of urban settlement has grown by 85% between 1985 and 2015, the share of urban areas exposed to the highest flood hazard level (inundation depth > 1.5 metres) has increased by 122% over the same period. As a result, in 2015, around 20% all urban settlement were located in zones with medium or higher flood risk – compared to 17,9% in 1985. Remarkably, the proportion of settlements in the highest risk category , has grown the most – from 4.3% in 1984 to 5.2% in 2015. Flood exposure is especially evident in low- and middle- income countries, where the proportion of urbanisation occurring in high and very high flood risk areas has outpaced growth in no- and low-risk areas. Currently vast portions of urban settlements in most developing countries are highly exposed, as showcased by the example of Ho Chii Min City, Vietnam in Figures 4 and 5.
Middle-income contries are the largest contributors to the global expansion of high flood risk settlement, most likely due to hightened development pressure and speculation. Indeed, among the urban areas featuring a very-high risk of flooding, some 81% are located in middle-income countries, compared to 1% in low-income countries and 18% in high-income countries. Of these, China accounts alone for 50% of the world’s high risk settlement areas in the world. This is worrysome, as many of these regions lack appropriate flood protection and mitigation strategies. And while the fact that high-income contries do no show a substantial increase in urban growth on high-risk areas since 1985, the truth is that these have locked-in high exposure well before 1985. And despite the substantial investement in flood defense and mitigation over the last 30 years, flood hazard in these regions continues to pose a threat to lives, livelihoods, and assets.
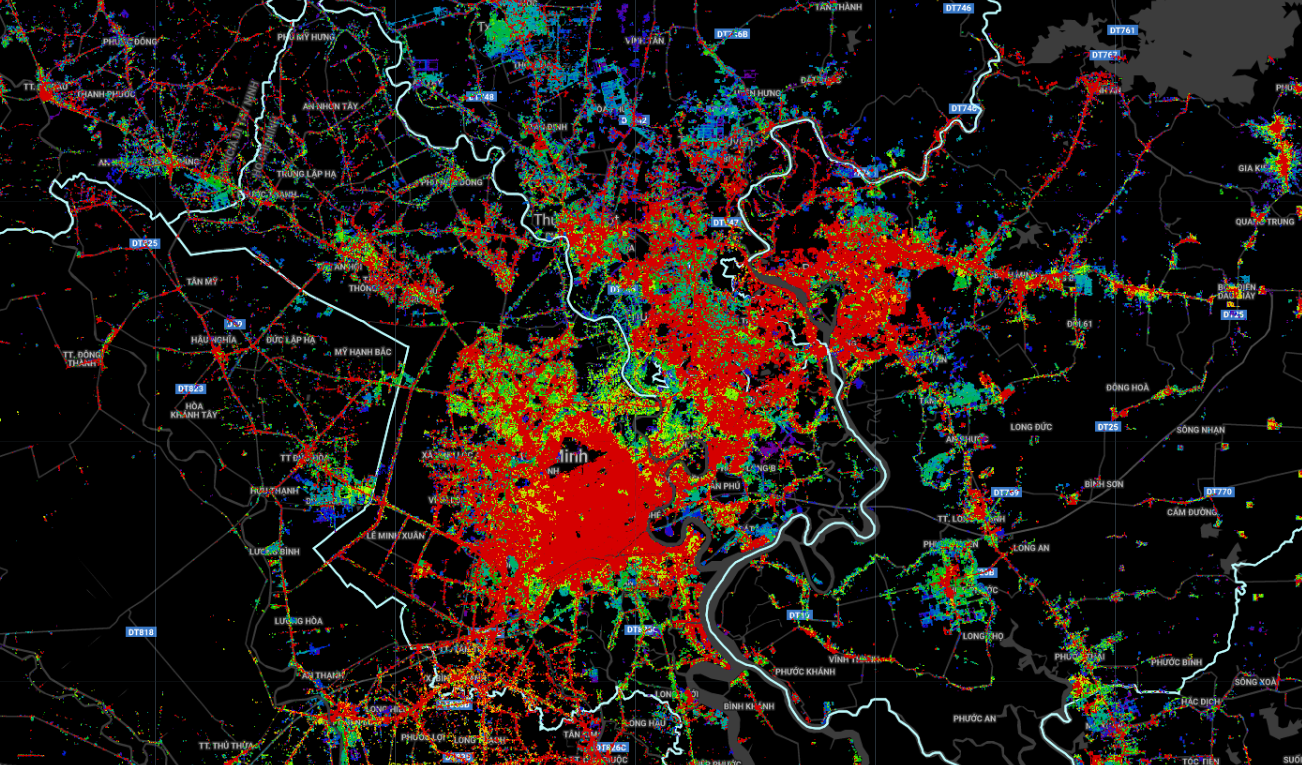
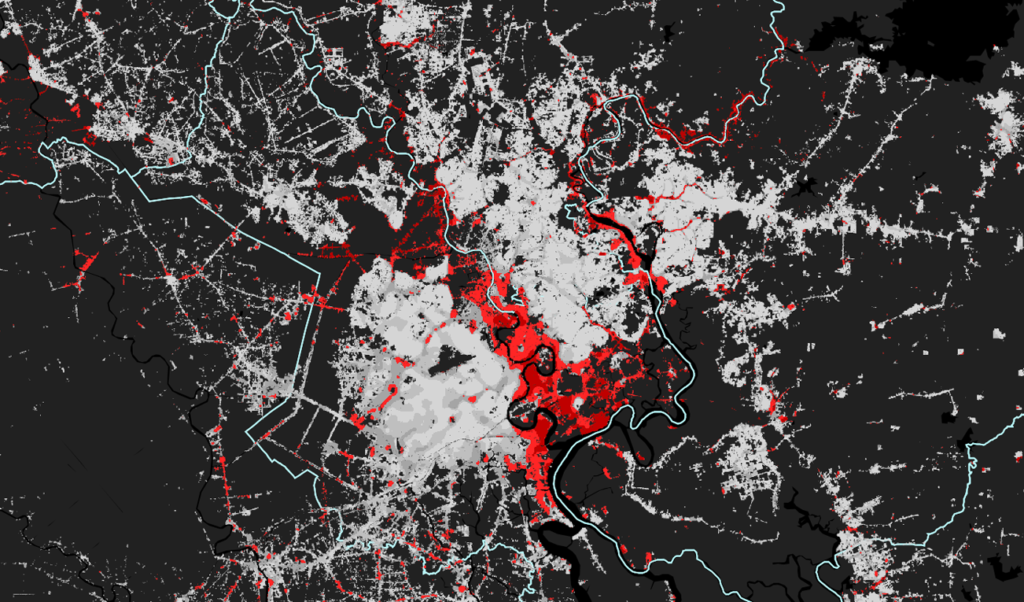
Figure 4: Ho Chi Minh City – Annual settlement extent growth 1985 to 2015 [left]; Flood exposure categories for the 2015 settlement extent [right].

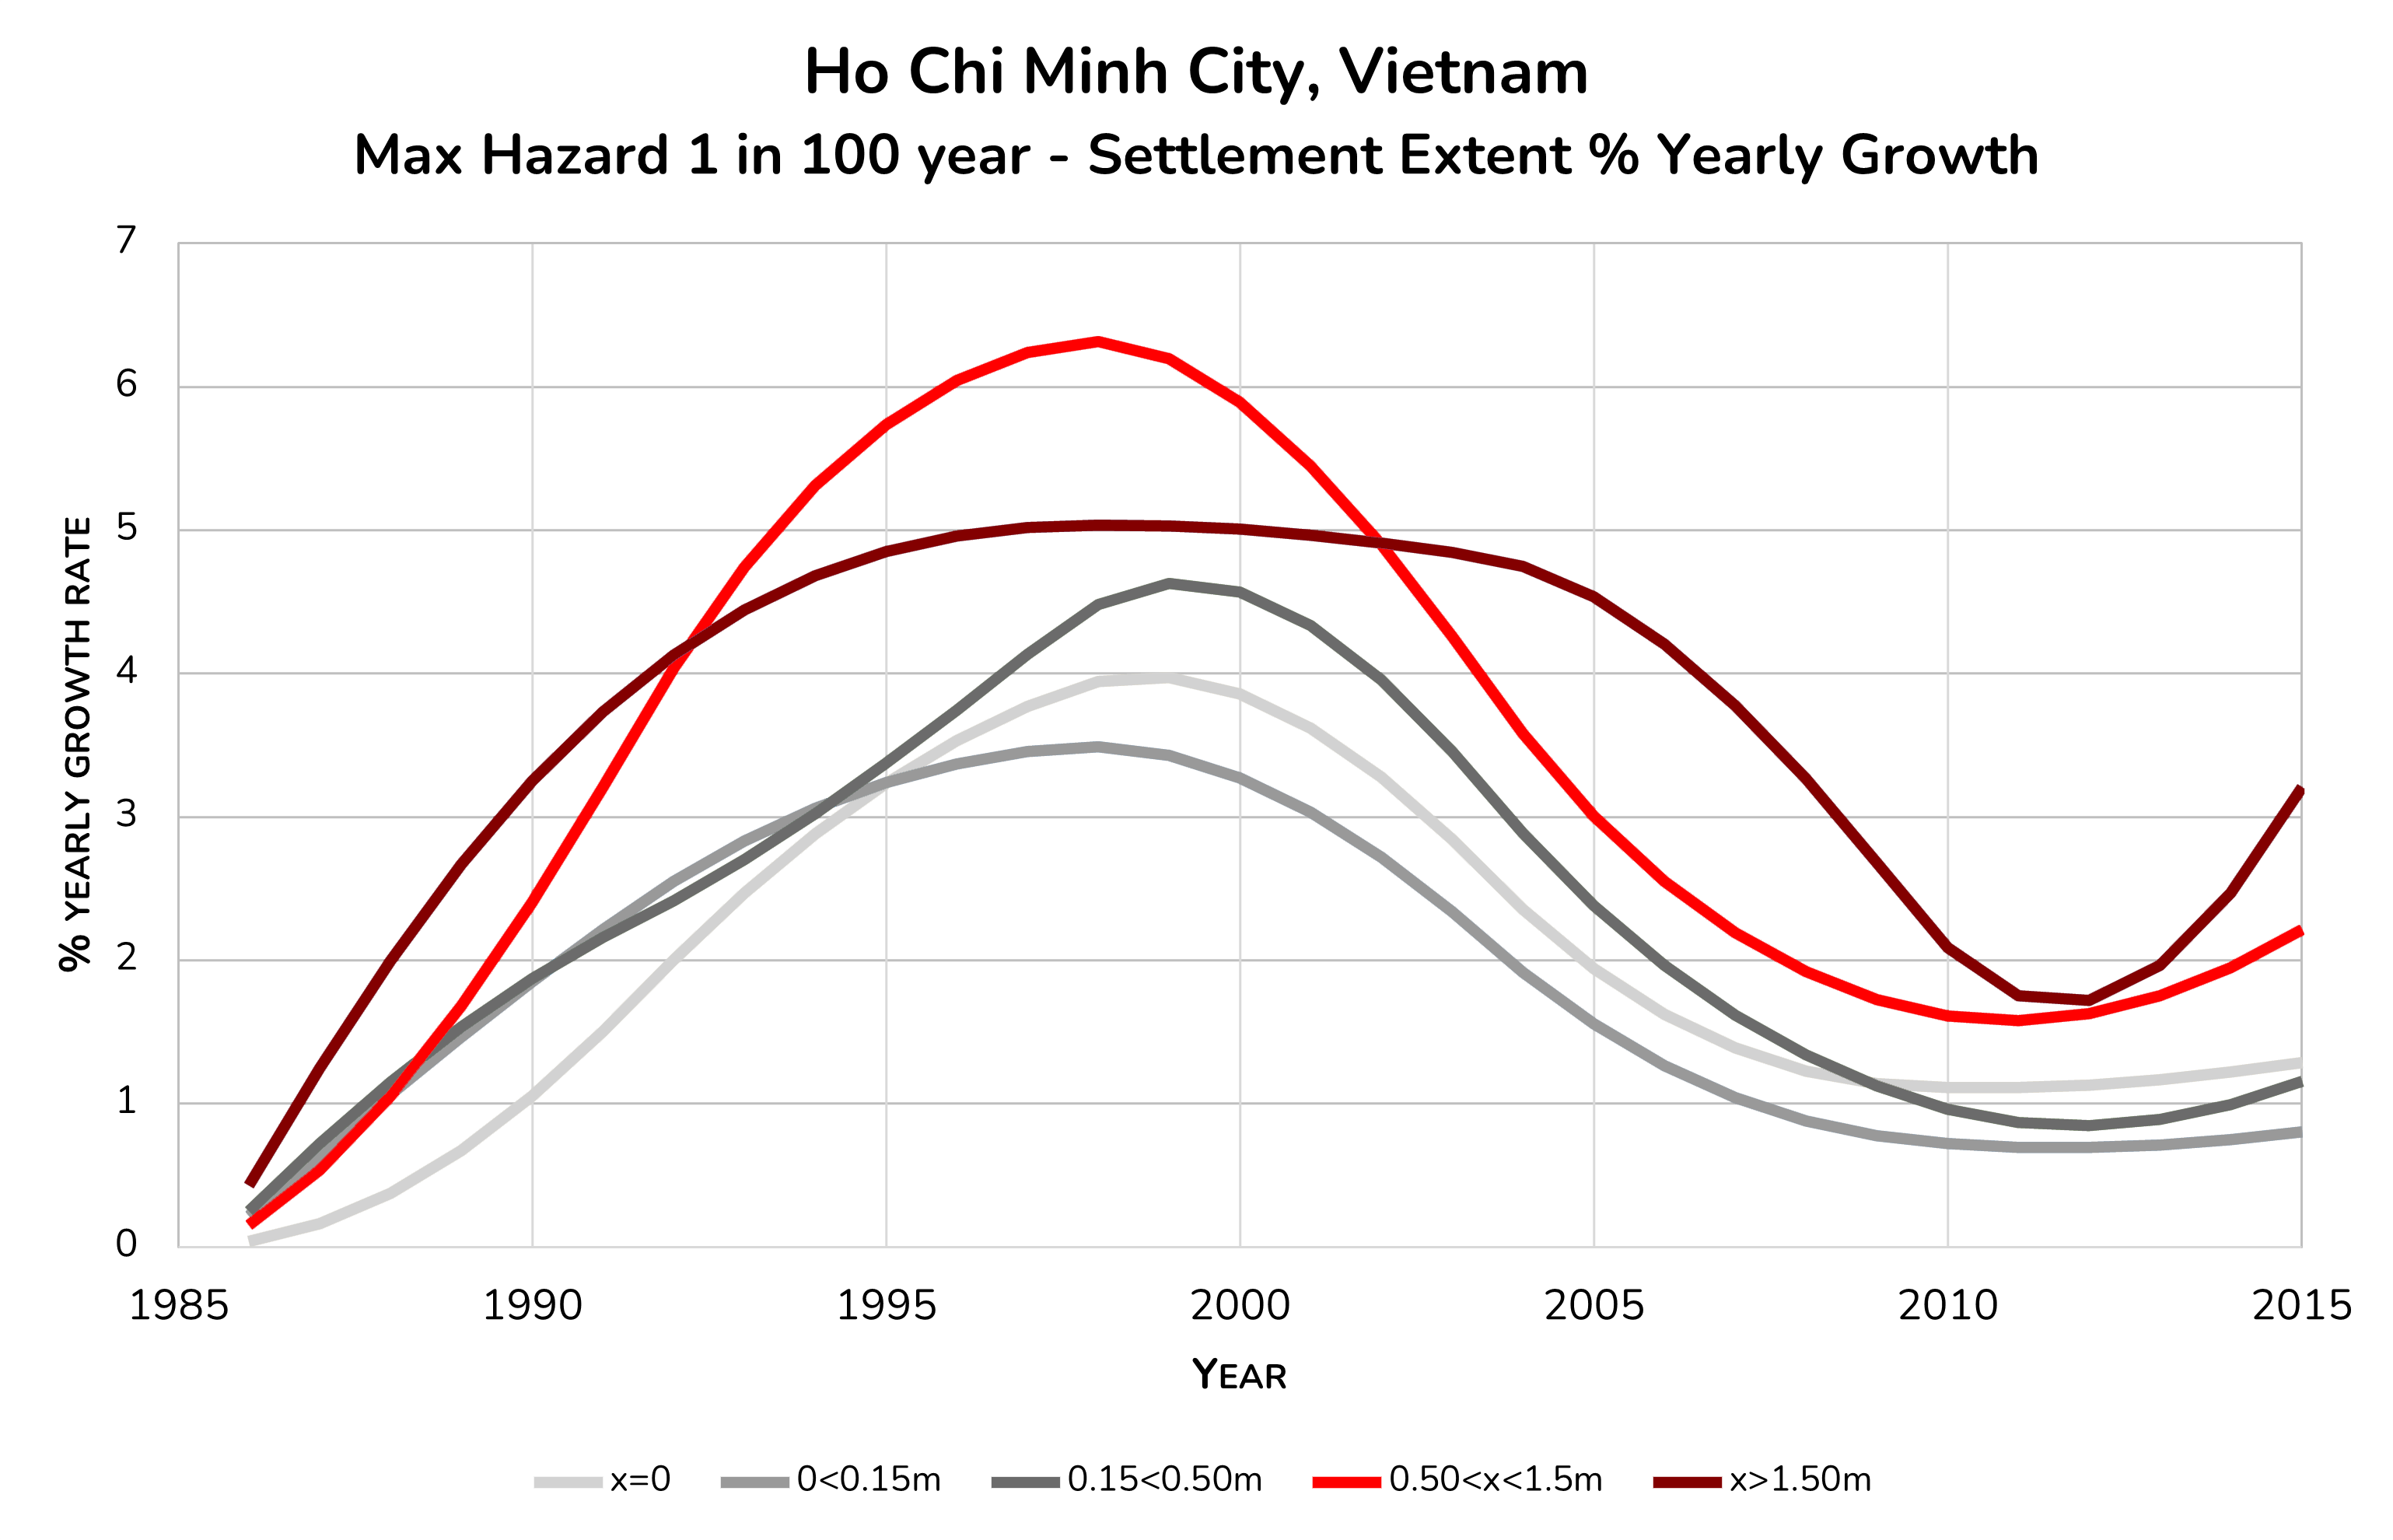
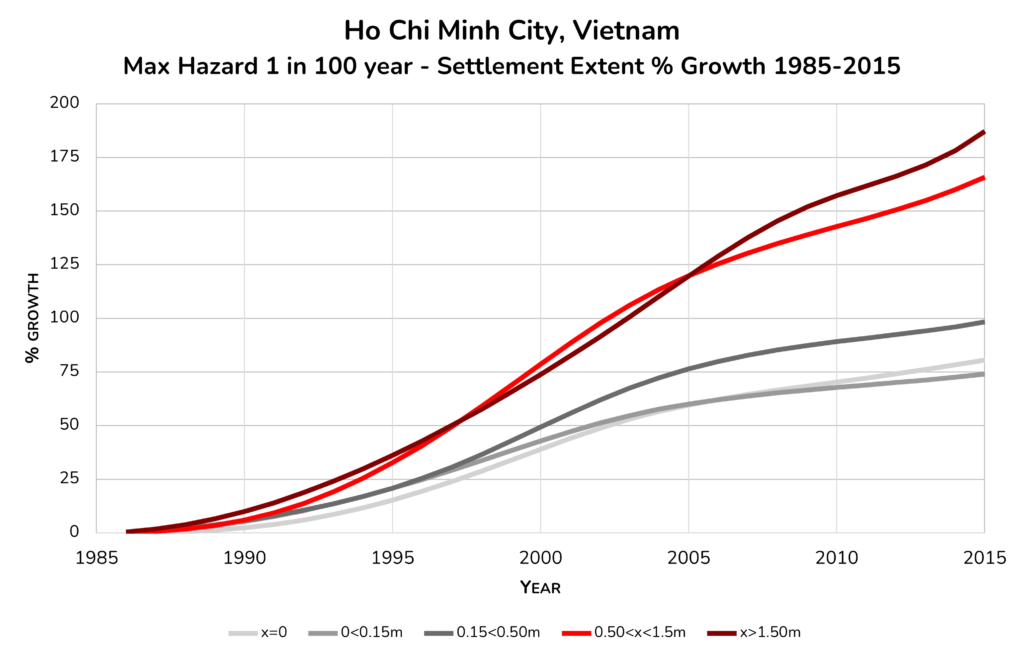
Figure 5: Ho Chi Minh City – Selected target indicators illustrating flood risk exposure: settlement extent in different flood hazard levels [left], settlement extent percent growth in each flood hazard level with respect to the previous year [center], settlement extent percent growth in each flood hazard level with respect to 1985 [right].
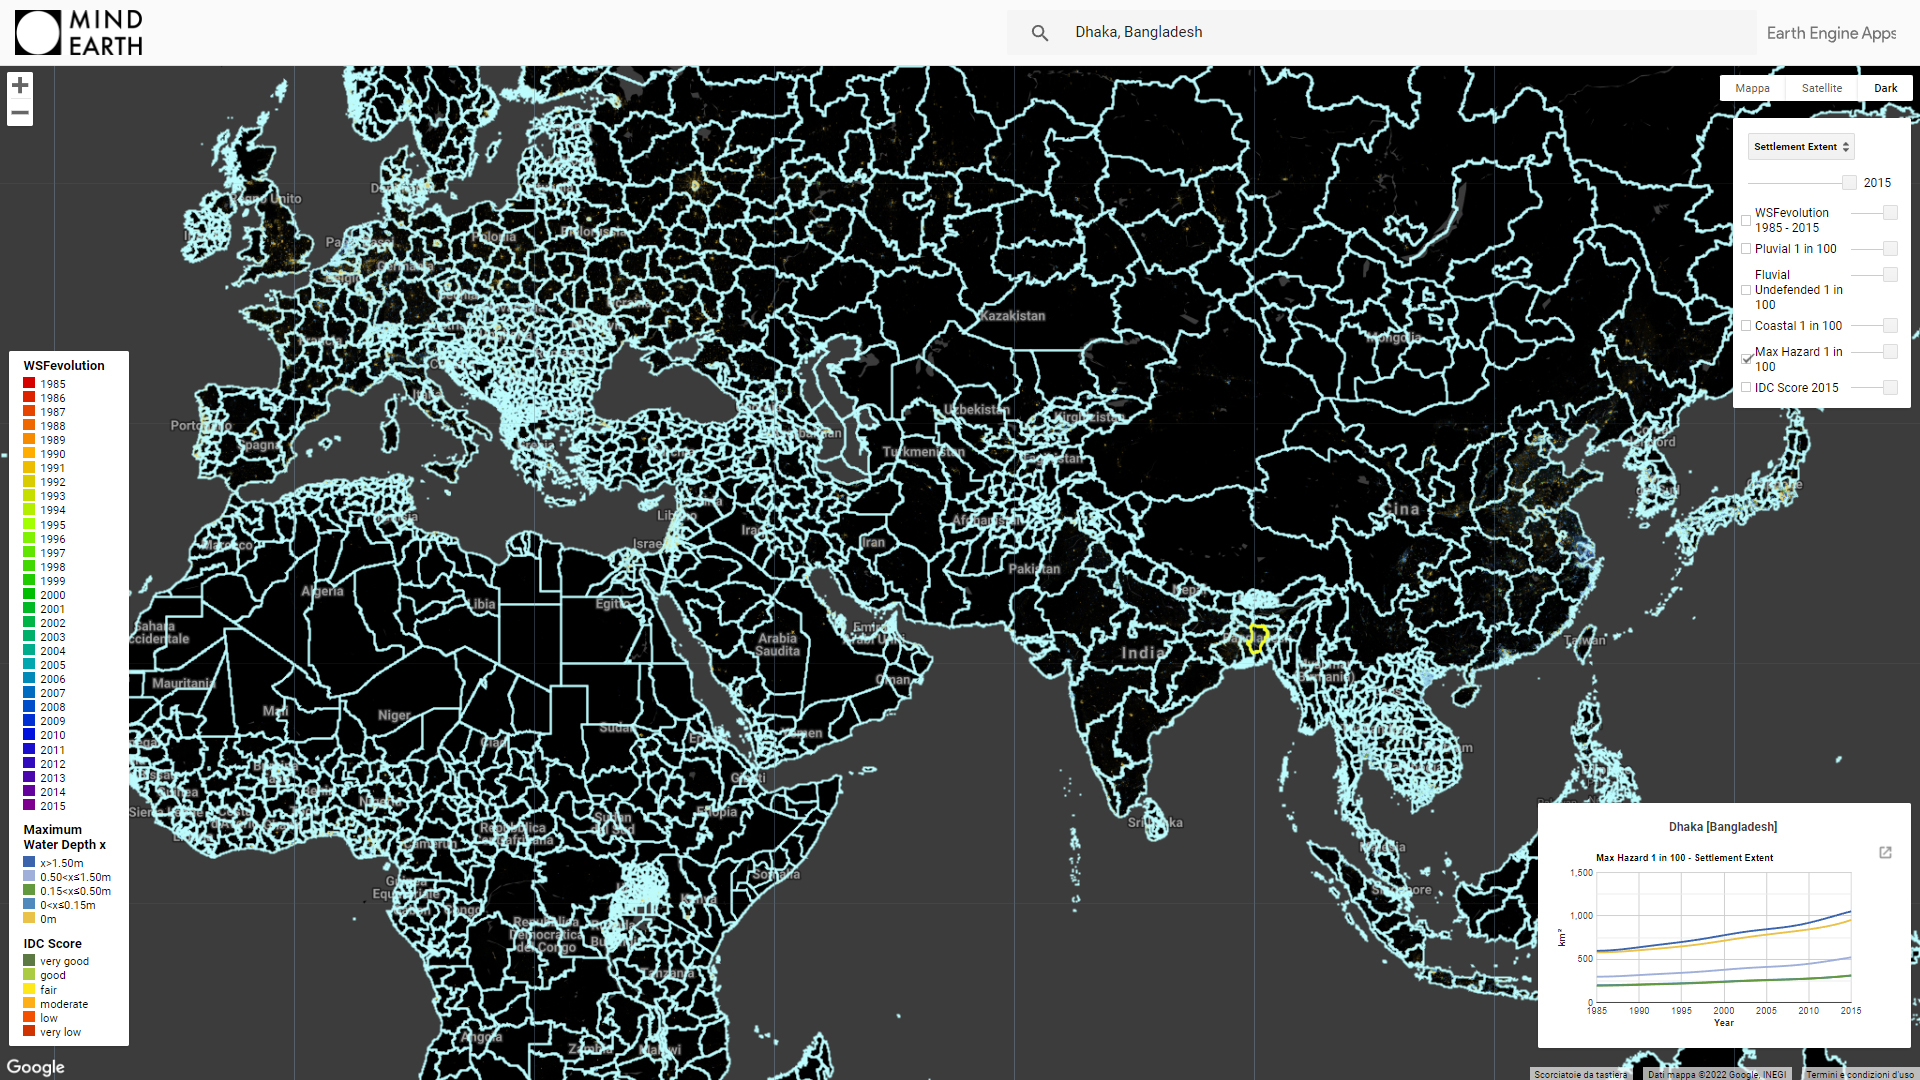
Figure 6: Experimental visualisation GGE platform.
Conclusions
Understanding clearly the spatial distribution of flooding risk exposure in relation to urban development patterns and trajectories is key to implement necessary strategies to minimise negative impacts on people, livelihoods and the economies. By computing information on urban settlement extent and flood risk (pluvial, fluvial and coastal) on regular intervals (1 year), it was possible to track the risk associated with new development and also better understand how/whether urbanization has occurred in high risk zones in the past. Furthermore, by aggregating the data at different levels (i.e. regional and income units),
It was also possible to easily identify geographical disparities, critical trends and hotspots of heightened vulnerability. And whilst this project focused on the analysis of currently available time series from the WSF (1985 to 2015), it also set a replicable methodology for the analysis of flood exposure over time at a global scale, which can be implemented at later points in time, as newer WSF layers or better flood maps become available.
Currently an experimental web platform is being developed to further support the interpretation of the results obtained in the study (Figure 6).
More projects of interest:
Advanced deep-learning for the estimation of spatial wealth through Copernicus Sentinel data and sparse in-situ survey data.
Mapping human behaviour before and after natural disasters using High-Frequency Location-Based data
Flood exposure and vulnerability mapping using street level image automatic acquisition and machine learning
An immersive A.I. Art experiment between poetry and photography for the Italian Pavilion at the XVII Venice Architecture Biennale.
Urban Digital Twin model for the visualisation, navigation and exploration of multiple information layers on cities in space and time.
Population estimation, destroyed buildings, and land use classification