Mobilkit: an advanced mobility data analysis library for disaster risk management
A high-performance Python library for the analysis of High Frequency Mobility Data to support disaster risk and response management
Mobilkit is a powerful library written in Python containing a set of high-performance tools for the analysis of High-Frequency Location Based mobility data. The library aims at providing innovative data-analysis pipelines to measure the response of large populations to natural disasters and infrastructural changes. The library has been developed in a joint project between MindEarth, the World Bank’s Urban Disaster Risk Management Unit (AFR 2), the World Bank’s Global Facility for Disaster Reduction and Recovery (GFDRR) and Purdue University.
Client
World Bank’s Urban Disaster Risk Management Unit
(AFR 2)
World Bank’s Global Facility for Disaster Reduction and Recovery (GFDRR)
Navigation
Background
In a world where urban population is constantly increasing, more people are exposed to natural disasters occurring in densely populated urban areas. That is why the design and development of effective evidence-based responses to natural disasters and infrastructural changes is key to shape more resilient urban communities.
The recent availability of High Frequency Location Based (HFLB) data (logging the individuals’ trajectories from their position-enabled smartphones) provides a unique proxy to measure the daily movements of large populations at an unprecedented level of spatial and temporal details. This layer of information can provide valuable insights for informing preparedness and response to natural disasters. And yet, as of today, there are very few tools enabling rapid analytics using HFLB data and even fewer specifically designed for disaster risk management. Furthermore, the complex nature of these multi-scale phenomena requires analysis pipelines able to handle different levels of temporal and spatial aggregation.
To fill this gap, the World Bank’s Global Facility for Disaster Reduction and Recovery (GFDRR) and the World Bank’s Urban Disaster Risk Management Unit (AFR 2) were looking for innovative, performant and easy to use tools to analyse large HFLB datasets to inform local stakeholders on response strategies to major disruptive events or transformations.
In this context, MindEarth developed mobilkit, an ad-hoc open-source Python-based toolkit designed to quickly detect how human mobility patterns change during a major event and to conduct scalable post-event analytics for Disaster Risk Management (DRM) and urban planning. Mobilkit achieves these goals by combining more traditional mobility analysis tools with newly developed ones in a single virtual ecosystem. Furthermore, mobilkit allows to quickly and easily extract figures on land use, commuting habits, displacement as well as to capture variations in the mobility habits of people over time at small and large spatio-temporal scales.
The mobilkit library
Mobilkit was developed with compatibility and scalability in mind. Its uniqueness is that it provides, in a single library, an end-to-end computational framework for DRM analytics – from loading, pre-processing, descriptive statistics and analysis, up to visualisation and output metrics. And since time is key when designing policies to respond to unexpected events, the toolkit leverages on the Dask framework to efficiently deal with both small amounts of data and large populations composed of millions of unique users.
The library is written in Python and, as said, is implemented, using the Dask computational framework. The latter unlocks a multi-node, high-performance data analysis pipeline by distributing the large load of computation to several CPUs or computing nodes.
This feature enabled the team to analyze the raw HFLB data used by MindEarth’s team in the “Disaster Resilience through Smartphone Location Data”project, which featured some 1.81 billion registered positions of about 1.2 million unique de-identified, opted-in users, totalling to about 80GB of data.
The library is also simple to use, as the different analysis functions are arranged in coherent submodules and all rely on a single, shared data structure, providing an intuitive and seamless analysis of data aggregated at different spatial and temporal scales.
This design allows for a quick and efficient extension of the library in case new analyses are required.
Use cases and potential applications
LAND USE ANALYSIS
One of the key use cases covered by the mobilkit library is land use detection. The latter aims at finding a functional representation of the city at different spatial resolutions, identifying which areas comply with a residential, commercial, workplace, etc. activity profile.
The mobilkit library unlocks a straightforward computation of these activity profiles – i.e., the temporal profiles of users or events recorded in one area at a given time- at a custom spatio-temporal aggregation level.
In Figure 1 we show the three coding steps needed to transform de-identified, device-level location events into the median weekly activity profile of different clusters of areas. Note that the library takes care of tessellating the data, computing the temporal profiles and normalizing them to obtain their residual activity using a high-level interface.
In Figure 2 we show the detected weekly temporal profiles of the different clusters of areas, i.e., groups of neighbourhoods that feature similar temporal profiles.
Mobilkit allows analysts to easily inspect their spatial distribution and the distance (measured in the multidimensional space of the temporal profiles) between the profiles of each area in the region of interest (ROI).
Besides the interest to reconstruct the land use of a given area, this tool can be applied to characterize the visit rate to different areas of a city and thus to locate the best venue where to open a new business, based on the expected behaviours and activity profiles of the foreseen customers.
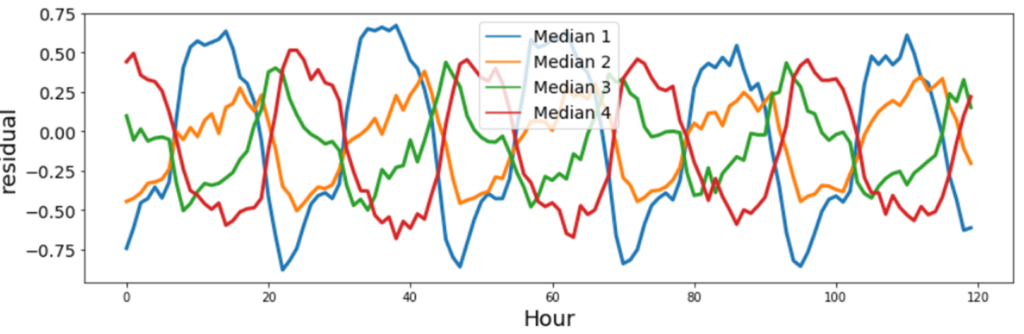
Figure 1: The analysis pipeline passing from raw data to the profiles of land use found in the Region Of Interest (ROI) in Mexico City.
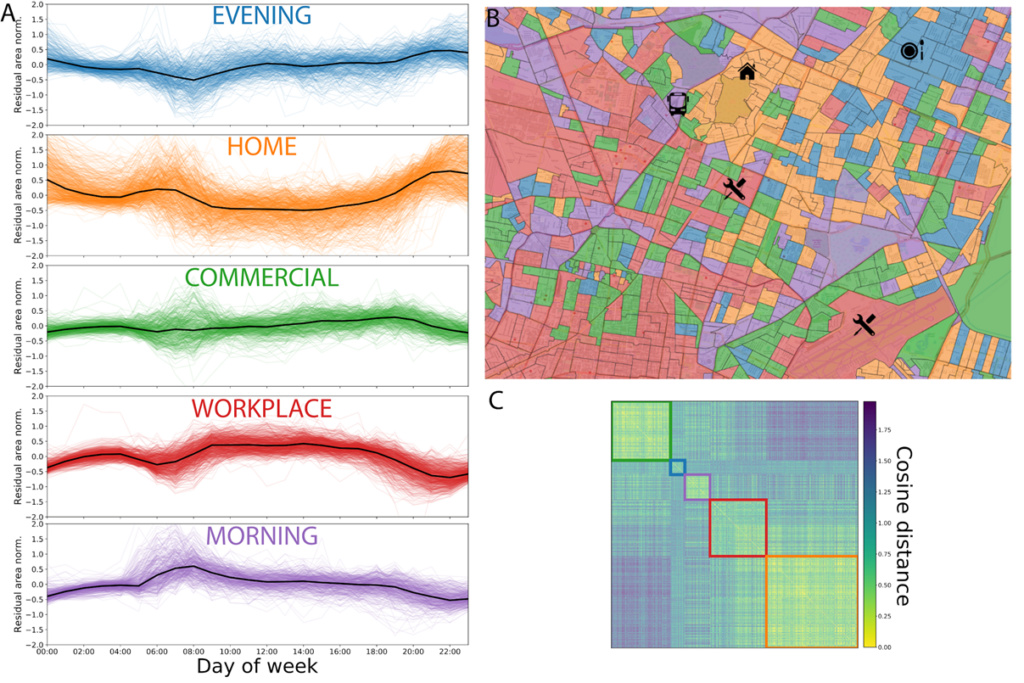
Figure 2: A (left): the normalized activity profiles of the areas grouped by the cluster they belong to. Different colours correspond to different land use categories, such as residential (Home) or business oriented (Work) areas. B (top right): the map of the land use found in the central area of Mexico City, colors are as in the left panel. We also show some major Points Of Interest (POIs) to underline the meaning of the detected land use. C (bottom right): the matrix of cosine distance (i.e., the reciprocal of similarity) between the temporal profiles of each area with the boxes highlighting the five clusters found.
COMMUTING HABITS
Another application covered by mobilkit is the measure of home/work based origin-destination matrices. The HFLB data can reveal the census area where a user is living (or working), providing a valuable alternative to classical population estimates. Indeed, the latter have been historically obtained via expensive census and surveys initiatives that cover a small fraction of the population and that do not provide a dynamical representation of the population behaviour.
On the contrary, as we will show later, the HFLB data unlock the possibility to dynamically measure the population present in a given area and to track sudden changes of the usual activity profiles in nearly real-time. Also in this case, besides the city-planning applications, the mobilkit library can provide useful insights on the basin of attraction of a given venue.
This allows guessing the socio-economic profile of people that will potentially pass by a commercial activity or a public service during their daily commuting.
Note that some data providers, like Cuebiq, obfuscate/obscure/alter the coordinates of the points falling near the user’s home location in order to preserve privacy. This means that one cannot locate the precise home of a user with a spatial resolution higher than the one used to obfuscate these data. If one is interested in the census area (or geohash) of the user’s home alone or he is using a spatial tessellation wider than or equal to the one used to obfuscate the data, then this is of no concern. However, tasks such as stop-detection or POI visit rate computation may be affected by the noise added to data in the user’s home location area.
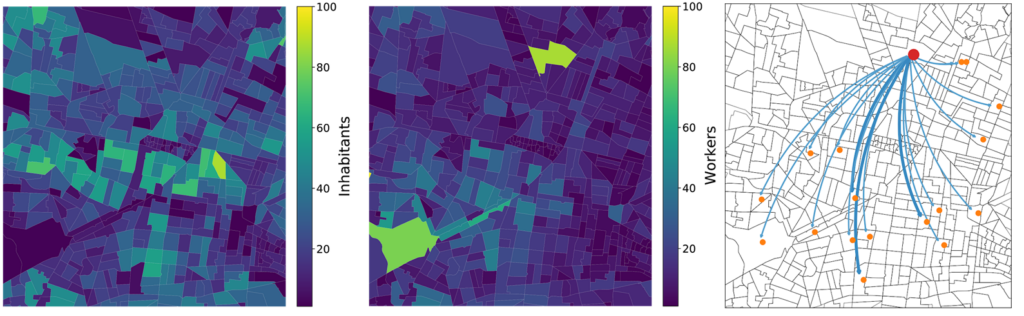
Figure 3: The number of inhabitants (left) and workers (center) estimated in each neighborhood of a central area of Mexico City. Note that the spatial distribution of the two quantities is significantly different. In the right plot we show the Origin-Destination matrix inferred for workers of the red-dot area, showing the most frequent home-areas where workers of that area come from.
DISPLACEMENT
The mobilkit library data can also be used for the analysis of displacement after extreme events. By displacement, we refer to the choice of people to spend a night outside of their residential census area after, for example, a disaster because they feel in danger or because their home got damaged.
The first step to measure the displacement rate is determining the predominant night-time location of each user in the weeks preceding the event: the corresponding census area will be, very likely, where “home” is in normal times. It follows that a user spending the night in a census area different from its home location can be said to be “displaced”.
In this way, it is possible to compare displacement rates both before and after an extreme event as well as between different geographies, as we did in our “Disaster Resilience through Smartphone Location Data” project.
In that occasion, not only we measured the sheer rate of displacement after the Puebla 2017 earthquake in Mexico, but we studied how displacement variated in relation to distance from the epicentre. Unsurprisingly, we observed a clear deviation from the baseline trend in the set of closest areas only (Figure 4).
This kind of analysis not only allows understanding indirectly which are the locations most heavily impacted by shocks – and hence where help is needed the most – but it makes it also possible to precisely analyse return rates, supporting activities of recovery monitoring.
It should also be noted that a similar approach can be extended to business oriented analysis, for example to measure how people change their preferred location during a specific period of the day (e.g., their free time after work) in response to changes of the offer in a given area or because of some targeted advertising campaigns.
Displacement Bin and Displacement Regions
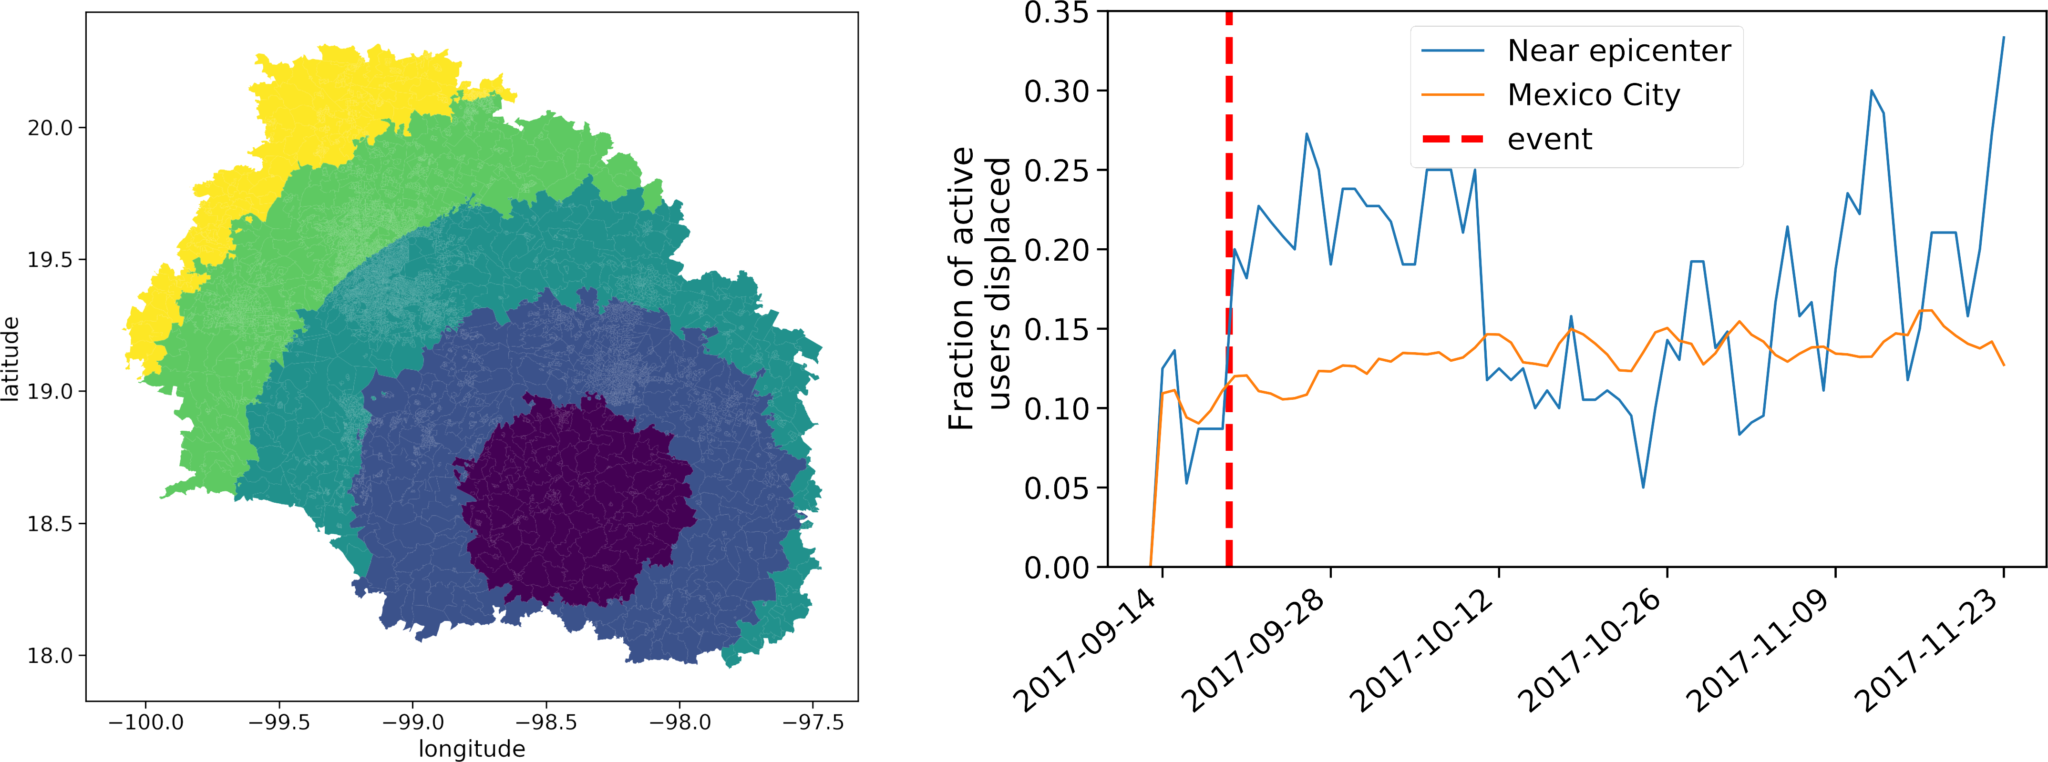
Figure 5. Implemented distance bins from the earthquake’s epicenter and comparison of the displacement rate in Mexico City and regions around the epicenter.
Displacement rate
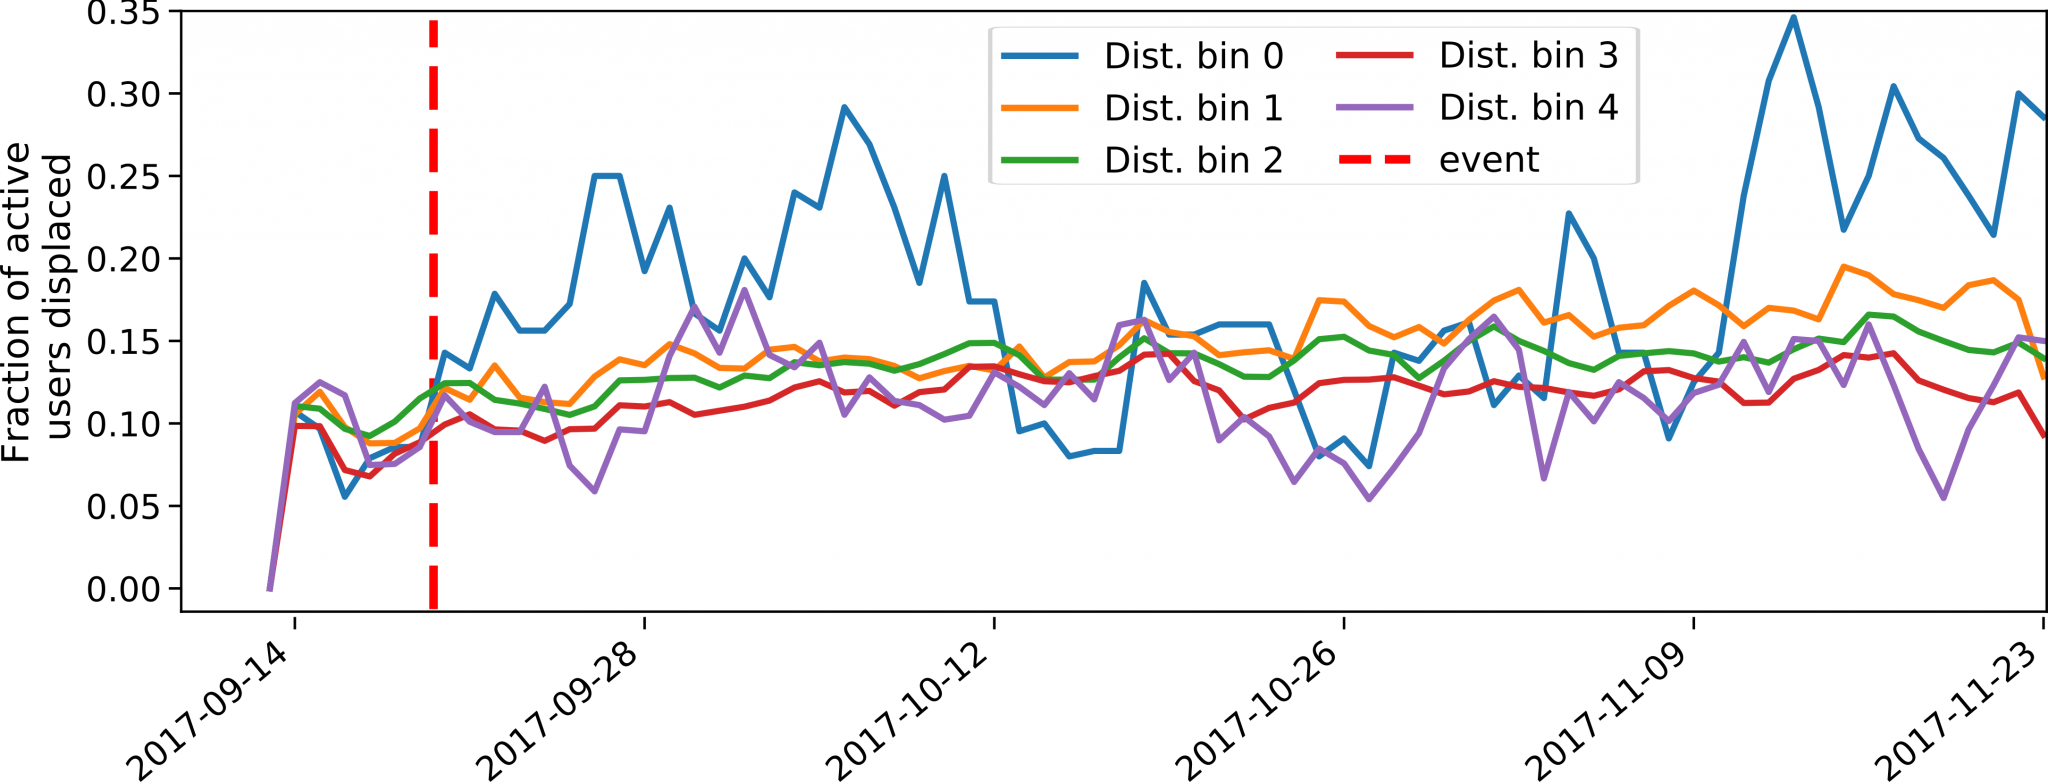
Figure 6. The displacement rate as measured in the 5 bins shown in the first panel. The closer bin (bin 0, blue line) features a higher response with respect to the others.
Ongoing activities
Mobilkit is an ongoing project in continuous development. If you want to know more about how mobilkit works, you can download our latest article on the Arxiv. Full documentation with examples can be found online here. Furthermore, if you want to try it out, the latest release of mobilkit is available on the project page. Here you can also find step-by-step coverage of the library and access many example notebooks for a more detailed showcase of the package’s capabilities.
Mobilkit is an open and active project and any contribution is welcome. Currently, MindEarth is working on further developments of the mobilkit toolkit – adding new functionalities and testing it on additional use cases of major natural events around the world – in collaboration with the GFDRR, see for example this paper on the Puebla earthquake. If you would like to contribute, feel free to fork the project, open an issue and contact us.
If you think that mobilkit can be useful to assist your urban planning and policy making or that it could be of help in supporting your business analytics, feel free to contact us to evaluate possible use cases.
More projects of interest:
Population estimation, destroyed buildings, and land use classification
An immersive A.I. Art experiment between poetry and photography for the Italian Pavilion at the XVII Venice Architecture Biennale.
Mapping human behaviour before and after natural disasters using High-Frequency Location-Based data
Flood exposure and vulnerability mapping using street level image automatic acquisition and machine learning
Urban Digital Twin model for the visualisation, navigation and exploration of multiple information layers on cities in space and time.
Mapping the relationship between urbanization and exposure to flood at a global scale between 1985 and 2015