A digital platform for an immersive and interactive experience cities in 4D.
The ESA Φ-Lab “Digital Twin Urban Pilot” project aimed at the development of integrated and responsive Urban Digital Twin models for the visualisation, navigation and exploration of multiple information layers on cities in space and time including, among others, free EO data, UAV and street-view imagery, air quality data and mobility records. By allowing an immersive and interactive experience of the urban environment the system offers a ready-to-use tool for policymakers.
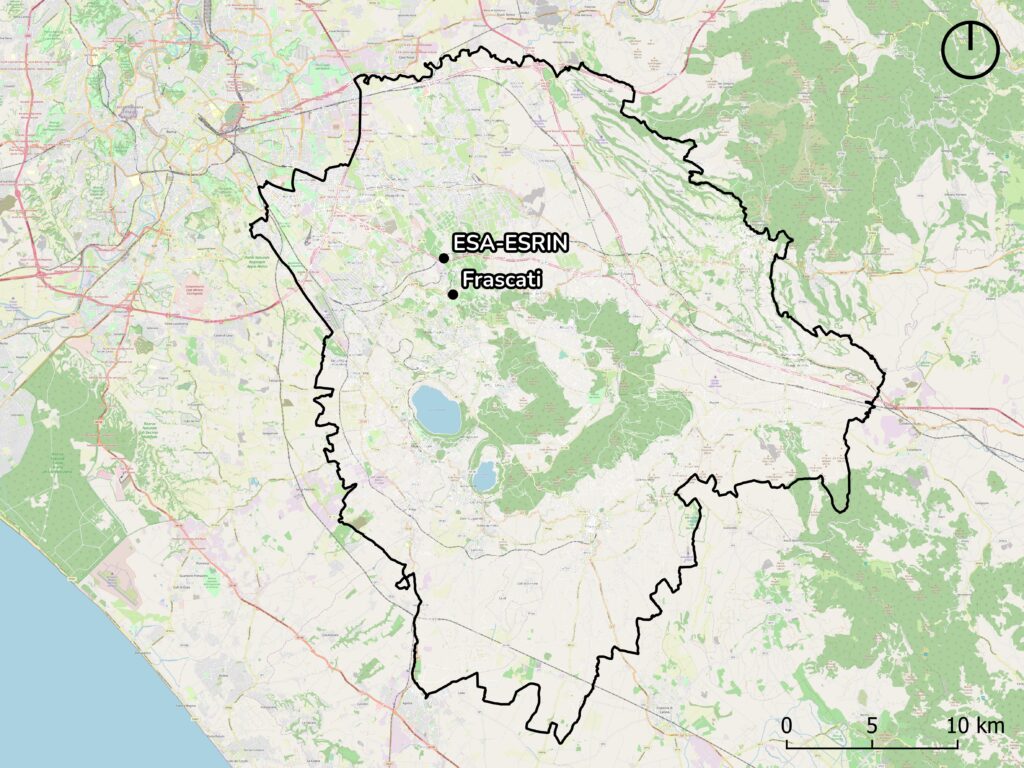
Figure 1: Region of interest, including the region of the Roman Castles;
Context
To address the complex and multi-dimensional challenge of programming and regulating the provision and management of fundamental urban infrastructure and services and of mitigating, responding and recovering from extreme events such as those related to climate change (i.e. urban heat island), urban planners and policy makers require a wide variety of accurate, reliable and detailed data and analyses.
In this context Urban Digital Twins are becoming increasingly promising tools. Urban Digital Twins are digital representations of any urban environment in 3D or 3D enriched with different kinds of geo-located information, which can be explored in a single interactive and navigable environment, often boasting virtual or augmented reality functionalities.
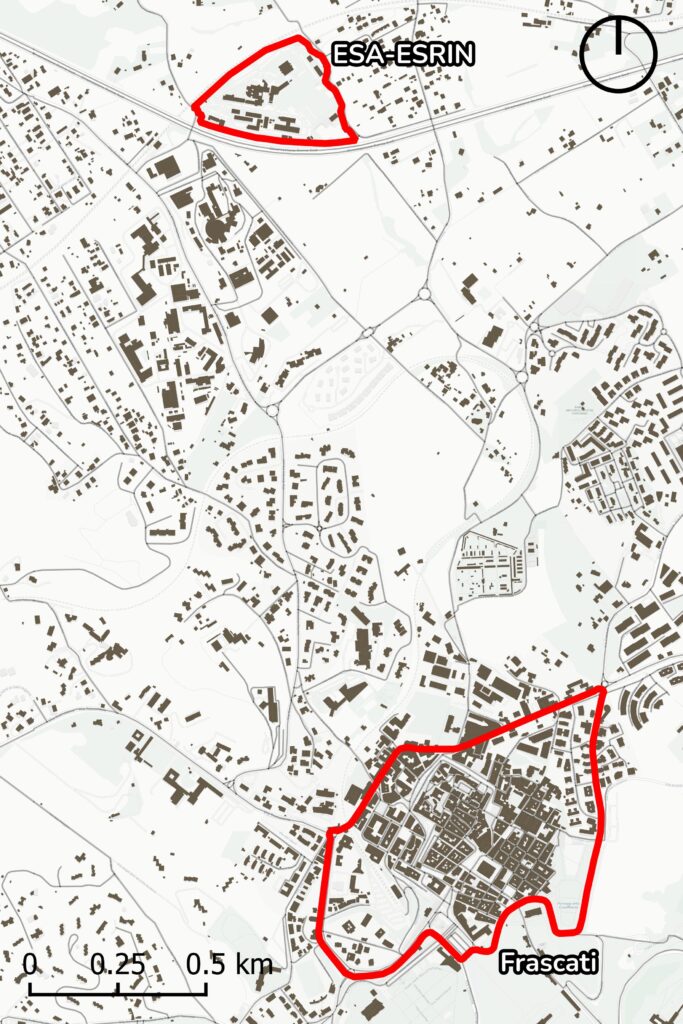
In this framework, MindEarth teamed with DLR and ESA Φ-Lab to develop a system which allows to visualisation and explore a pilot 4D Urban Digital Twin (UDT) targeting an area of 83K ha in the region of the Roman Castles (Italy). This was populated with anumber of information layers Sentinel-based products (i.e., monthly median S3 day/night LST, S5P tropospheric NO2 concentration, S1-based subsidence deformation rates), census units, building footprints and height, road network, points of interest, built environment indicators, terrain topography, in-situ weather and air quality measurements, hydrogeologic hazard maps, transportation indicators (+timetables), mobility indicators (generated out of High-Frequency Location-Based data for the year 2020) and real estate information. Additionally, for two sub-areas enclosing the ESA-ESRIN establishment and the Frascati town center, a fully textured, explorable, geo-referenced 3D model has been derived from in-situ UAV and street-view panoramic imagery (Figure 2):
All data layers populating the developed DT are made available through a responsive virtual navigation platform accessible either from PCs or mobile devices (links to relevant platforms are provided in Section 3 of the current report) and via two dedicated mobile applications featuring virtual reality (VR) and augmented reality (AR) technology enabling an immersive and interactive experience of the user with the DT.
The project is configured as a pilot initiative whose results might enable a number of relevant follow-up studies and applications.
Data Integration and Analytics
To build a complete and informative model of the area of interest, we relied on a variety of spatio-temporal data layers, including:
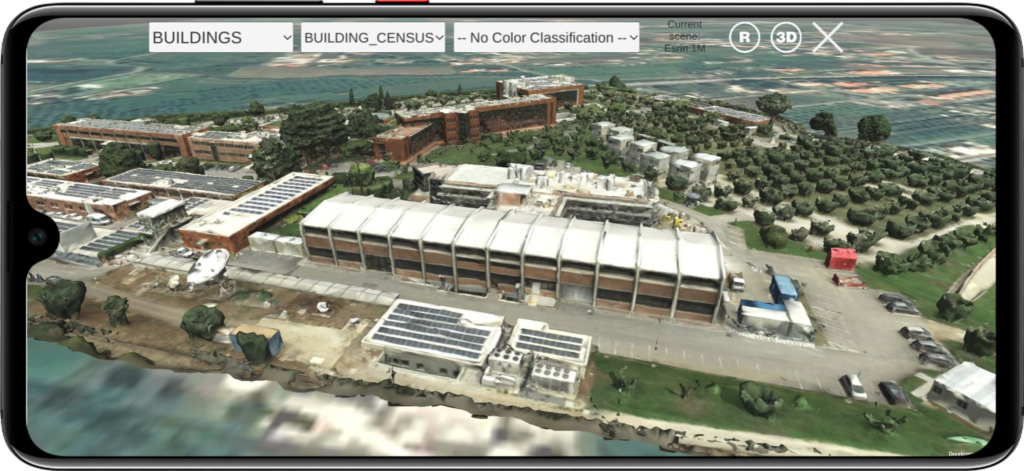
Ultra-high-resolution UAV imagery covering the town of Frascati and the ESA – ESRIN campus (Figure 2).
Freely-available EO products derived from Landsat and ESA Copernicus Sentinel imagery.
Data on building footprints, streets and points of interest, provided by OpenStreetMap nd enriched with information on building height obtained from the Lazio Region Geoportal.
Data on atmospheric and climatic conditions including temperature, humidity, atmospheric pressure, wind velocity and precipitations between 2013 – 2021, provided byARPA Lazio’s micro-meteorological network,
Mobility dataprocessed via mobilkit, MindEarth’s open-source toolkit, a high performance framework to efficiently analyse HFLB data to extract spatial and dynamical indicators.
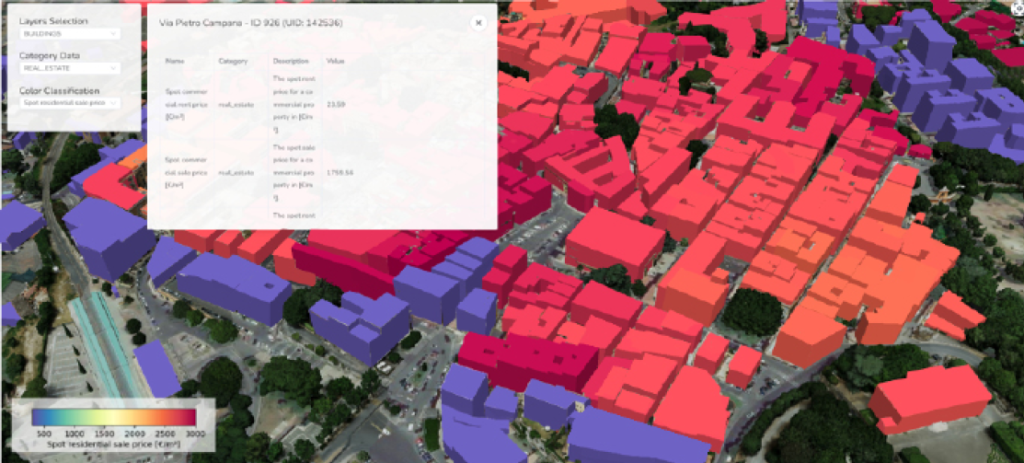
Real estate data containing information on sale and rent prices of residential and commercial properties obtained from one of the leading real estate platform in Italy.
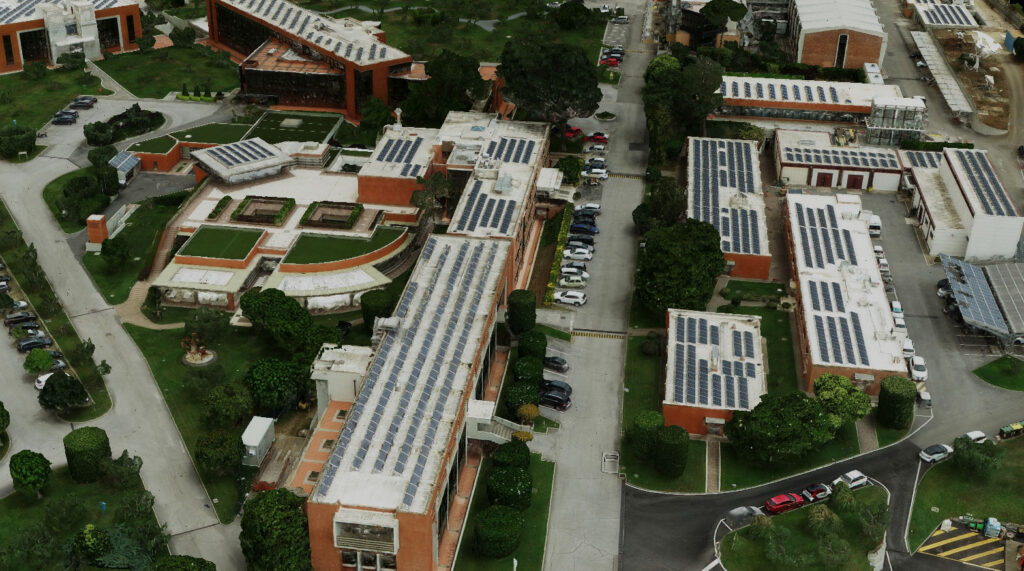
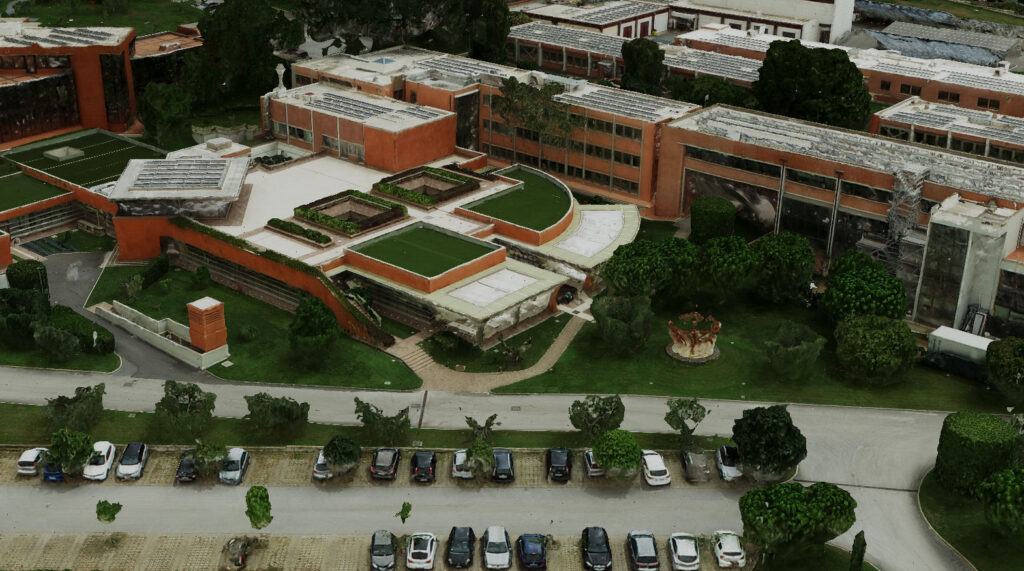
Data collected in situ: UAV imagery and 3D model
Figure 2: Area comprising the ESRIN campus and Frascati town center for which in-situ UAV imagery has been collected.
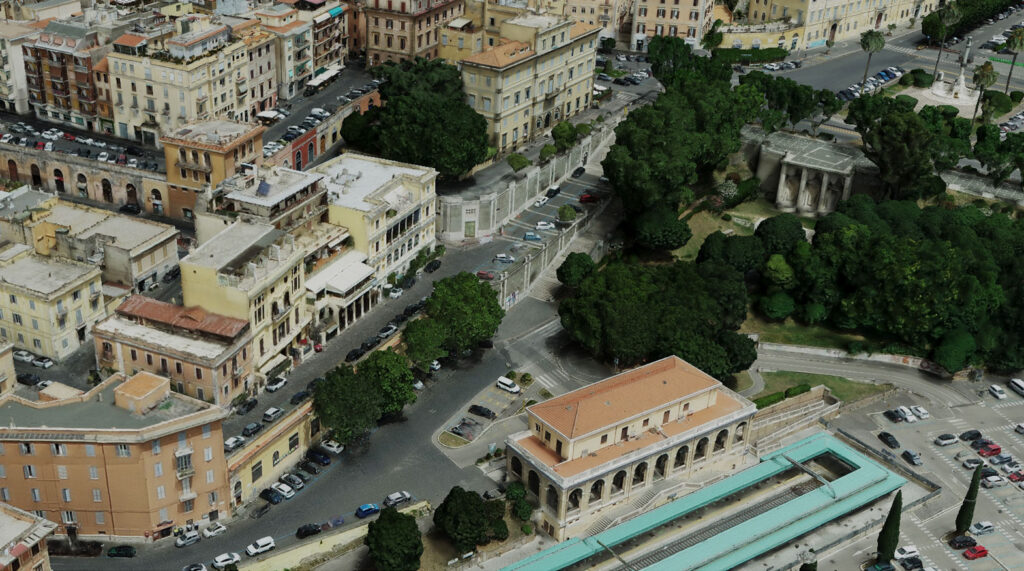
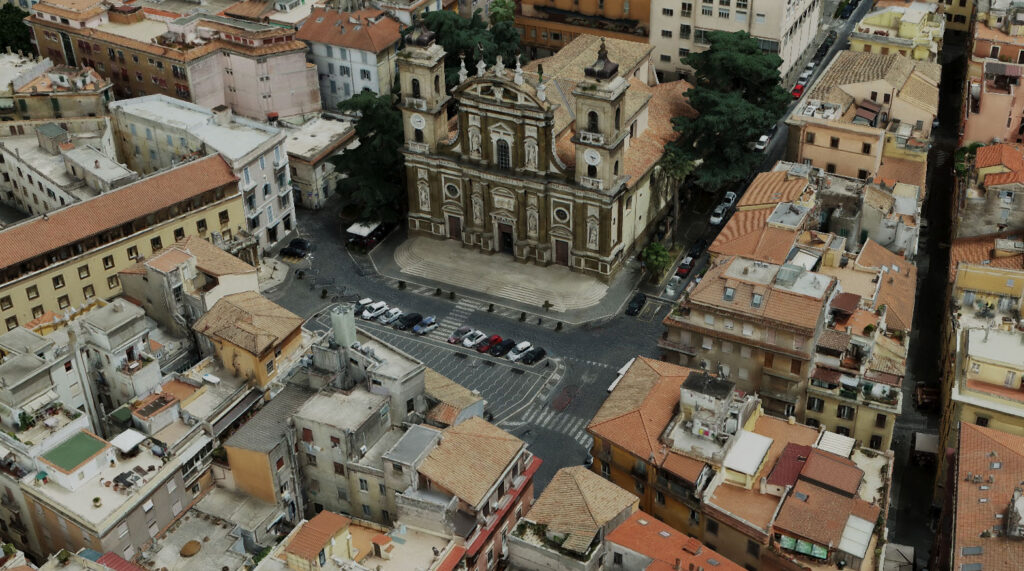
Figure 3: 3D view of the textured digital surface model (DSM) generated for the Frascati town center (left) and ESRIN campus (right) from UAV imagery acquired at 3cm resolution in June 2021 by using the Agisoft Metashape software.
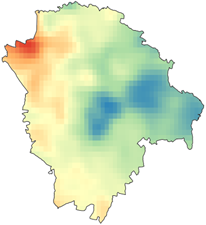
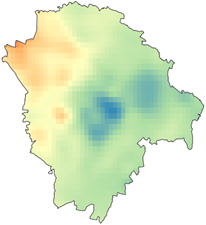
Earth Observation data: Land Surface Temperature and Air Quality
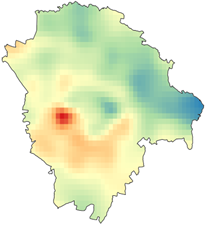
Monthly median night Sentinel-3 LST
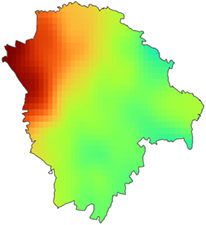
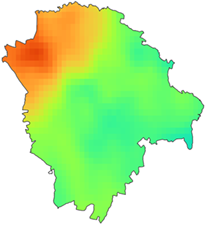
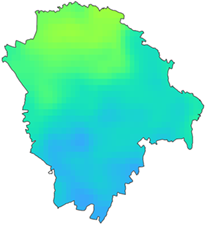
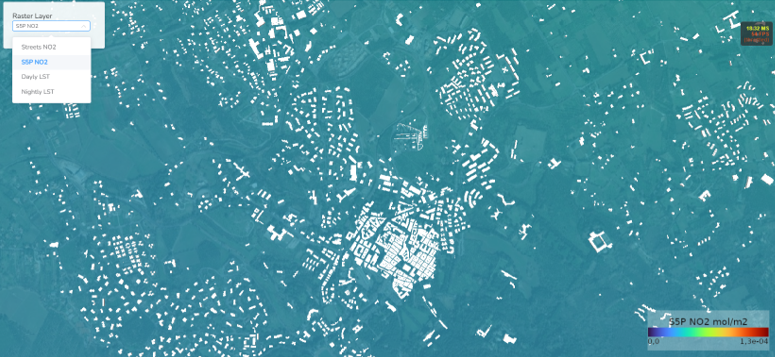
S5P tropospheric NO2 concentration
May 2021
September 2021
January 2022
February 2020
March 2020
April 2020
Figure 4: Monthly median night Sentinel-3 (S3) land surface temperature (LST) computed at 1km spatial resolution over the targeted study region for May 2021, September 2021 and January 2022.
Figure 5: Monthly median Sentinel-5P (S5P) tropospheric NO2 concentration computed at 1km spatial resolution over the target region of interest for February 2020, March 2020 and April 2020.
Ancillary Data
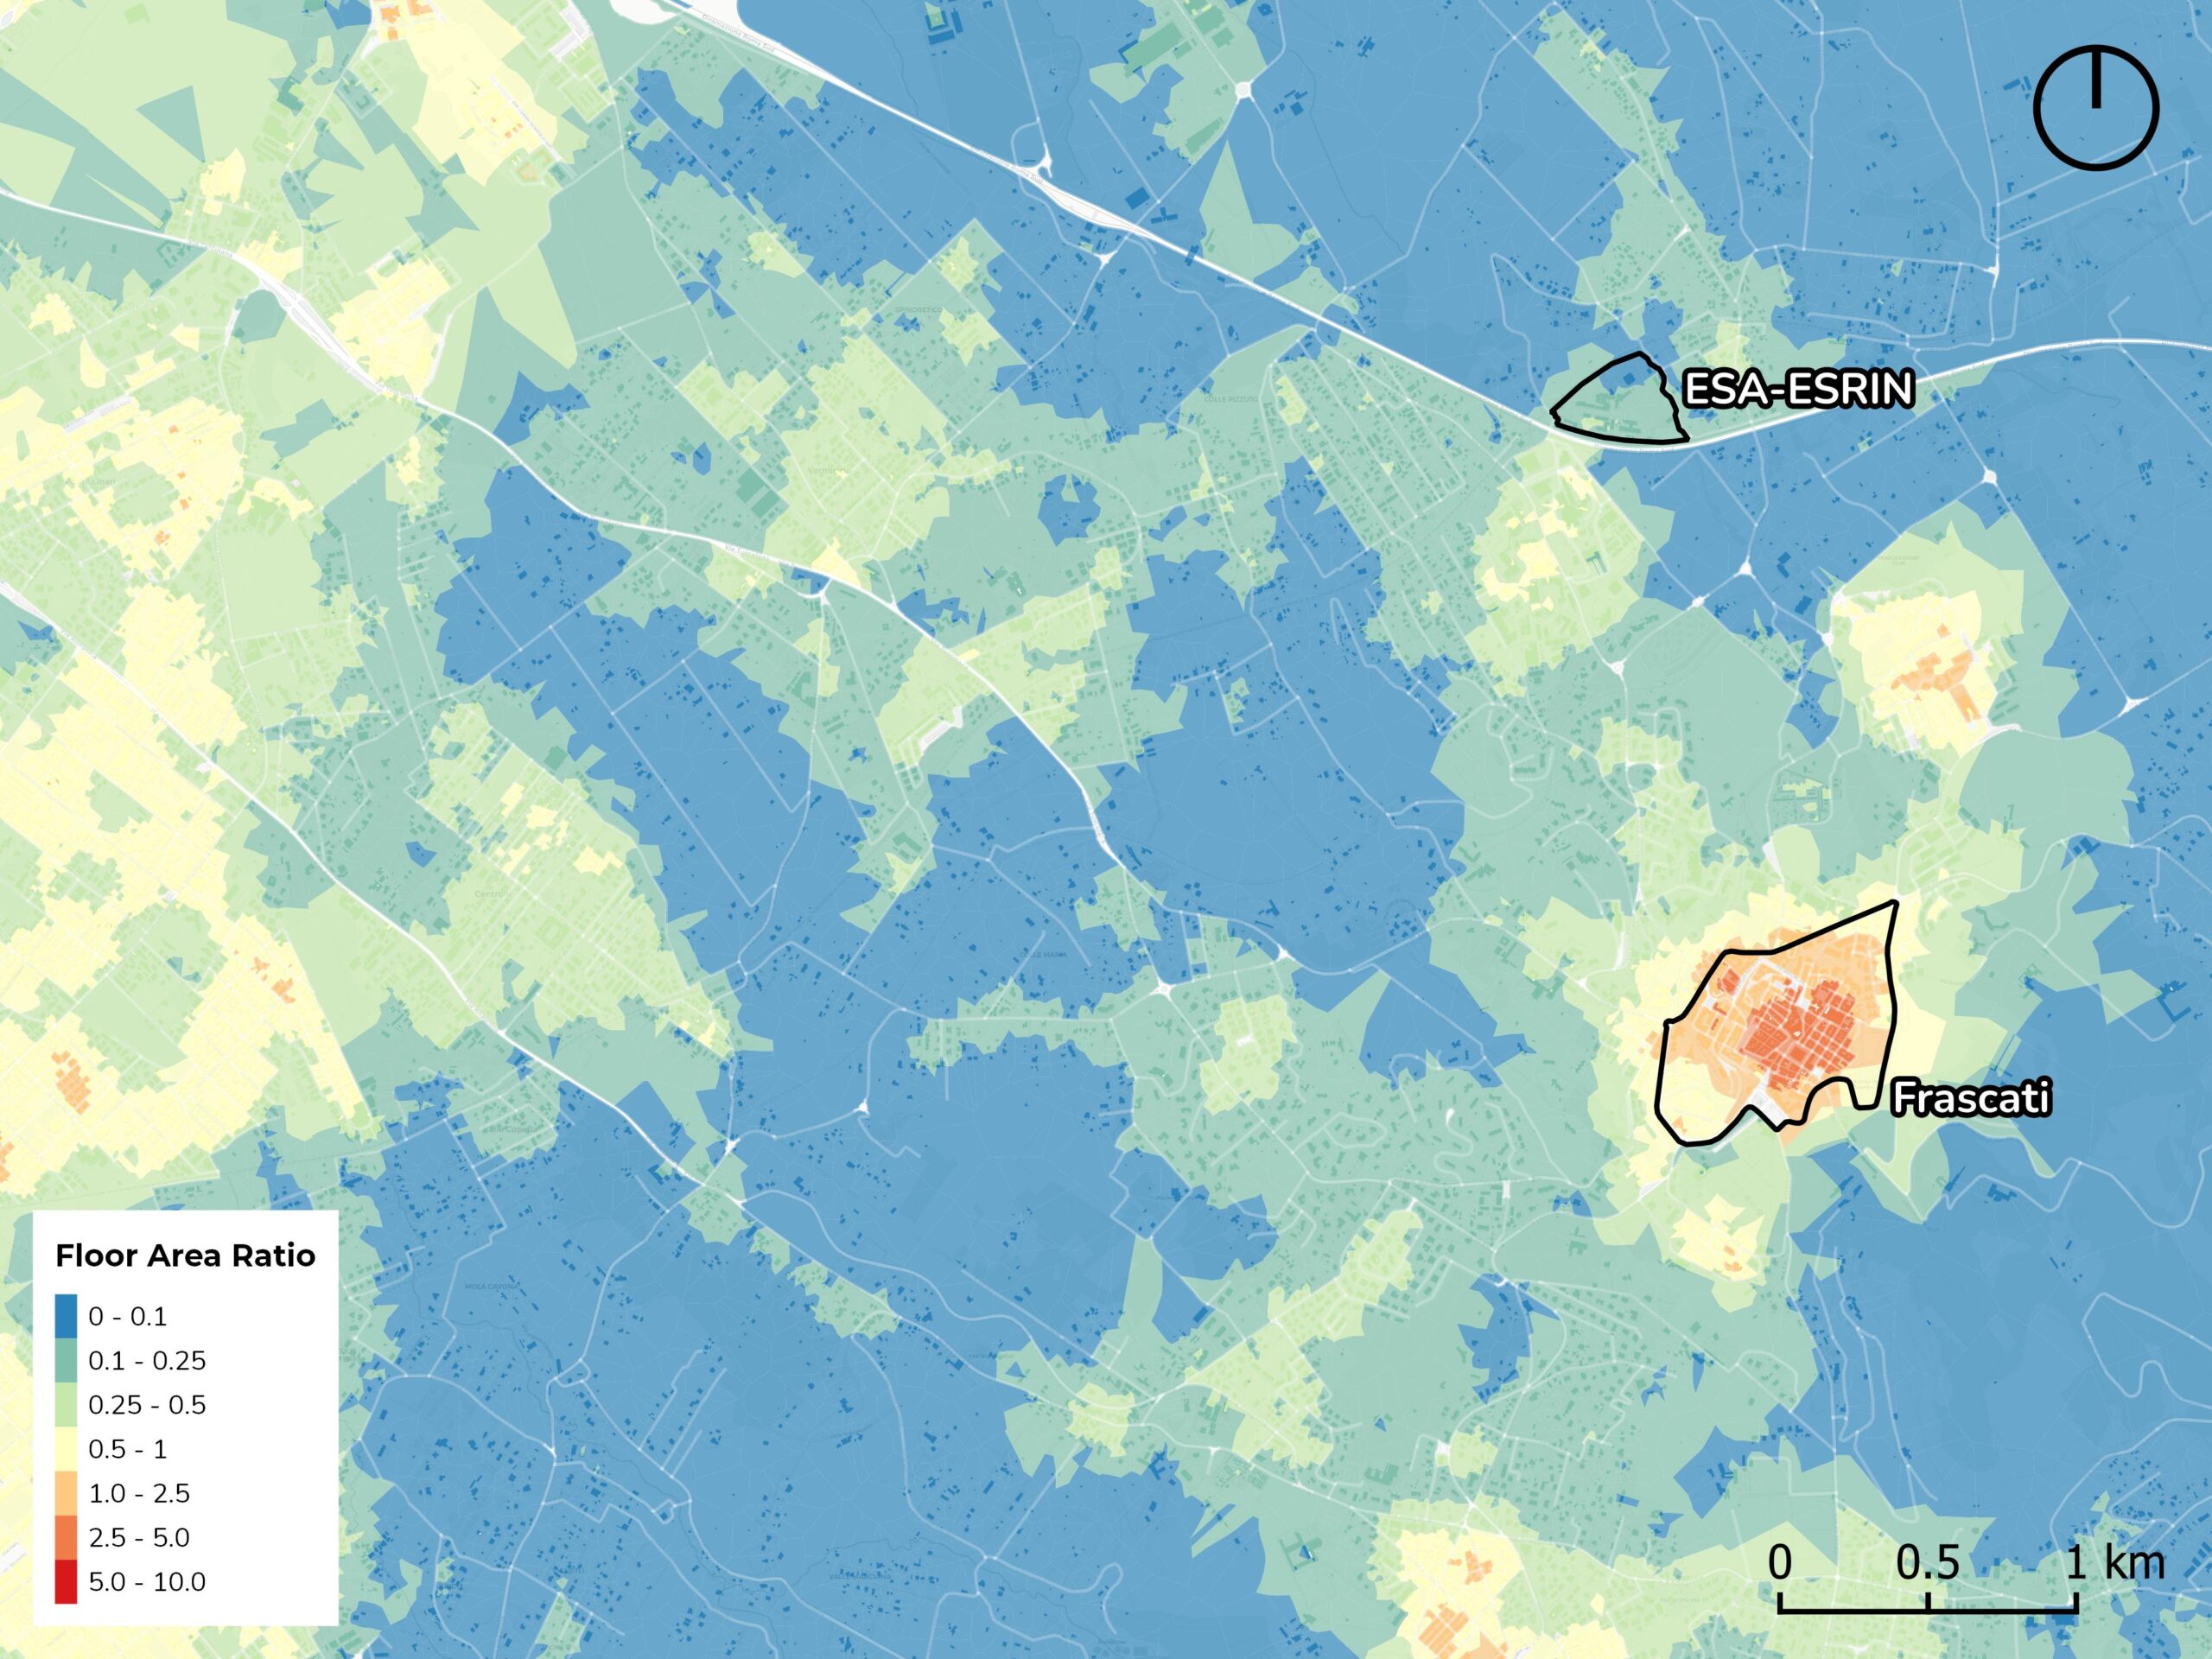
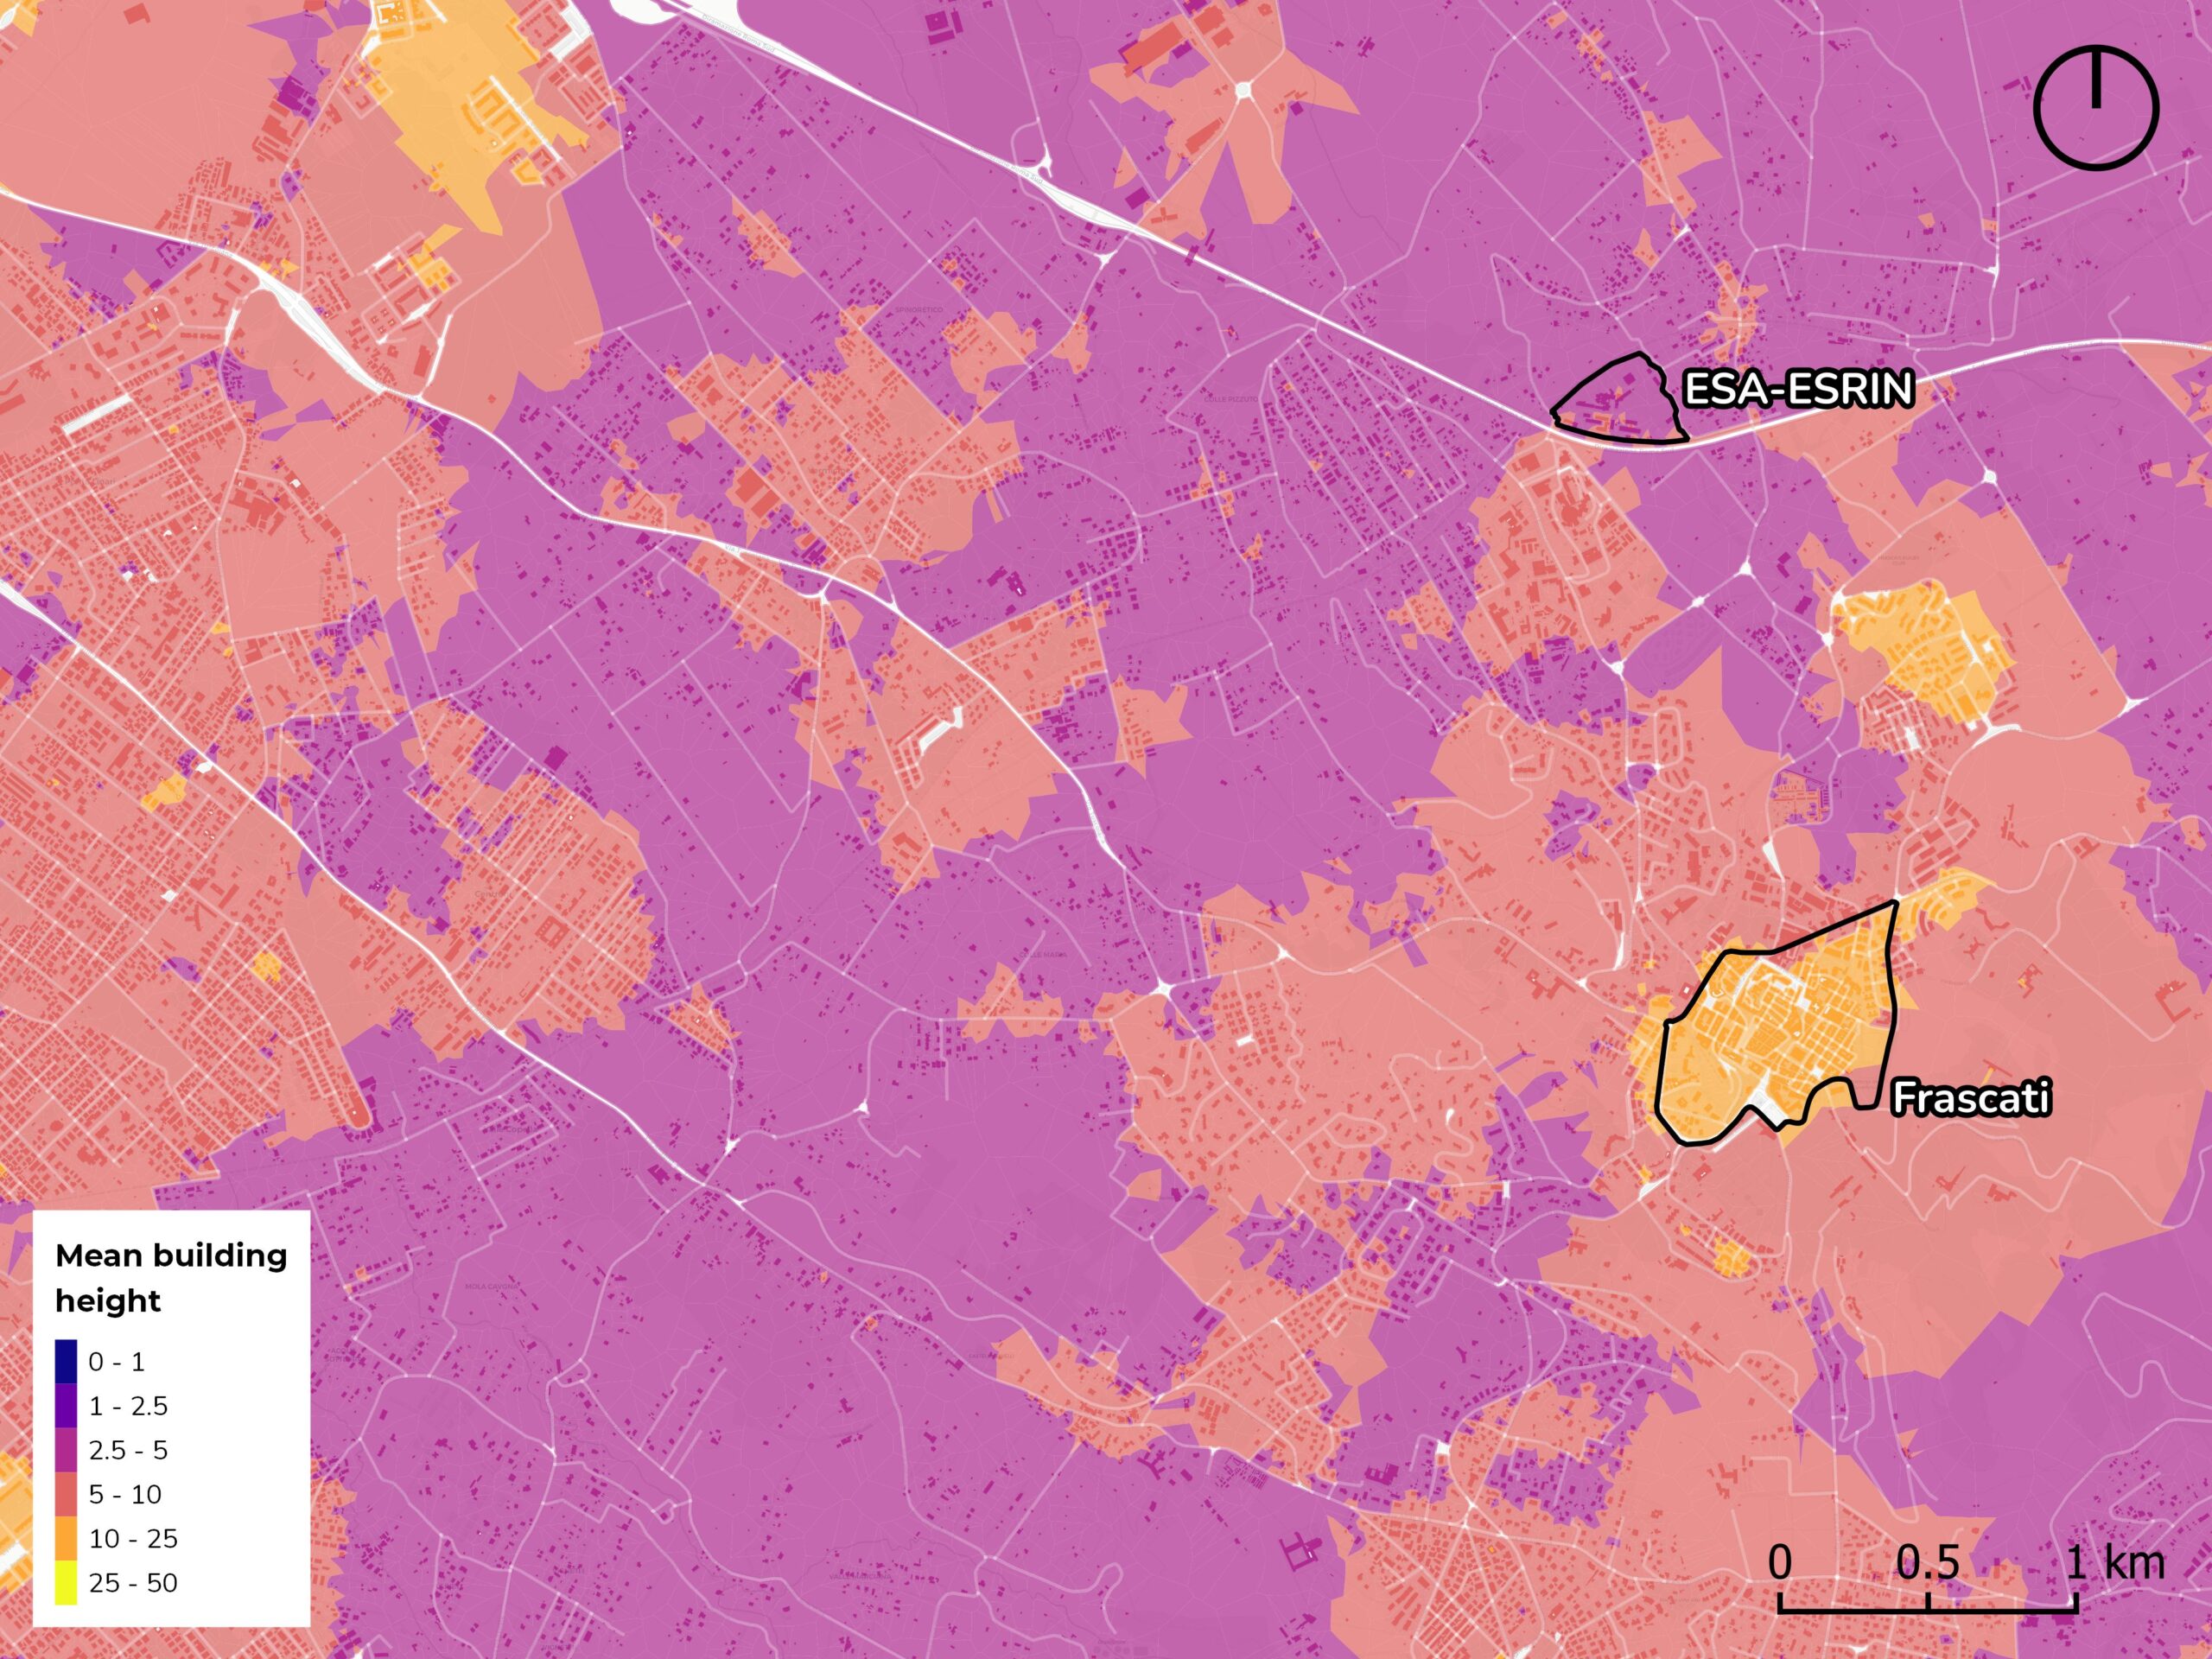
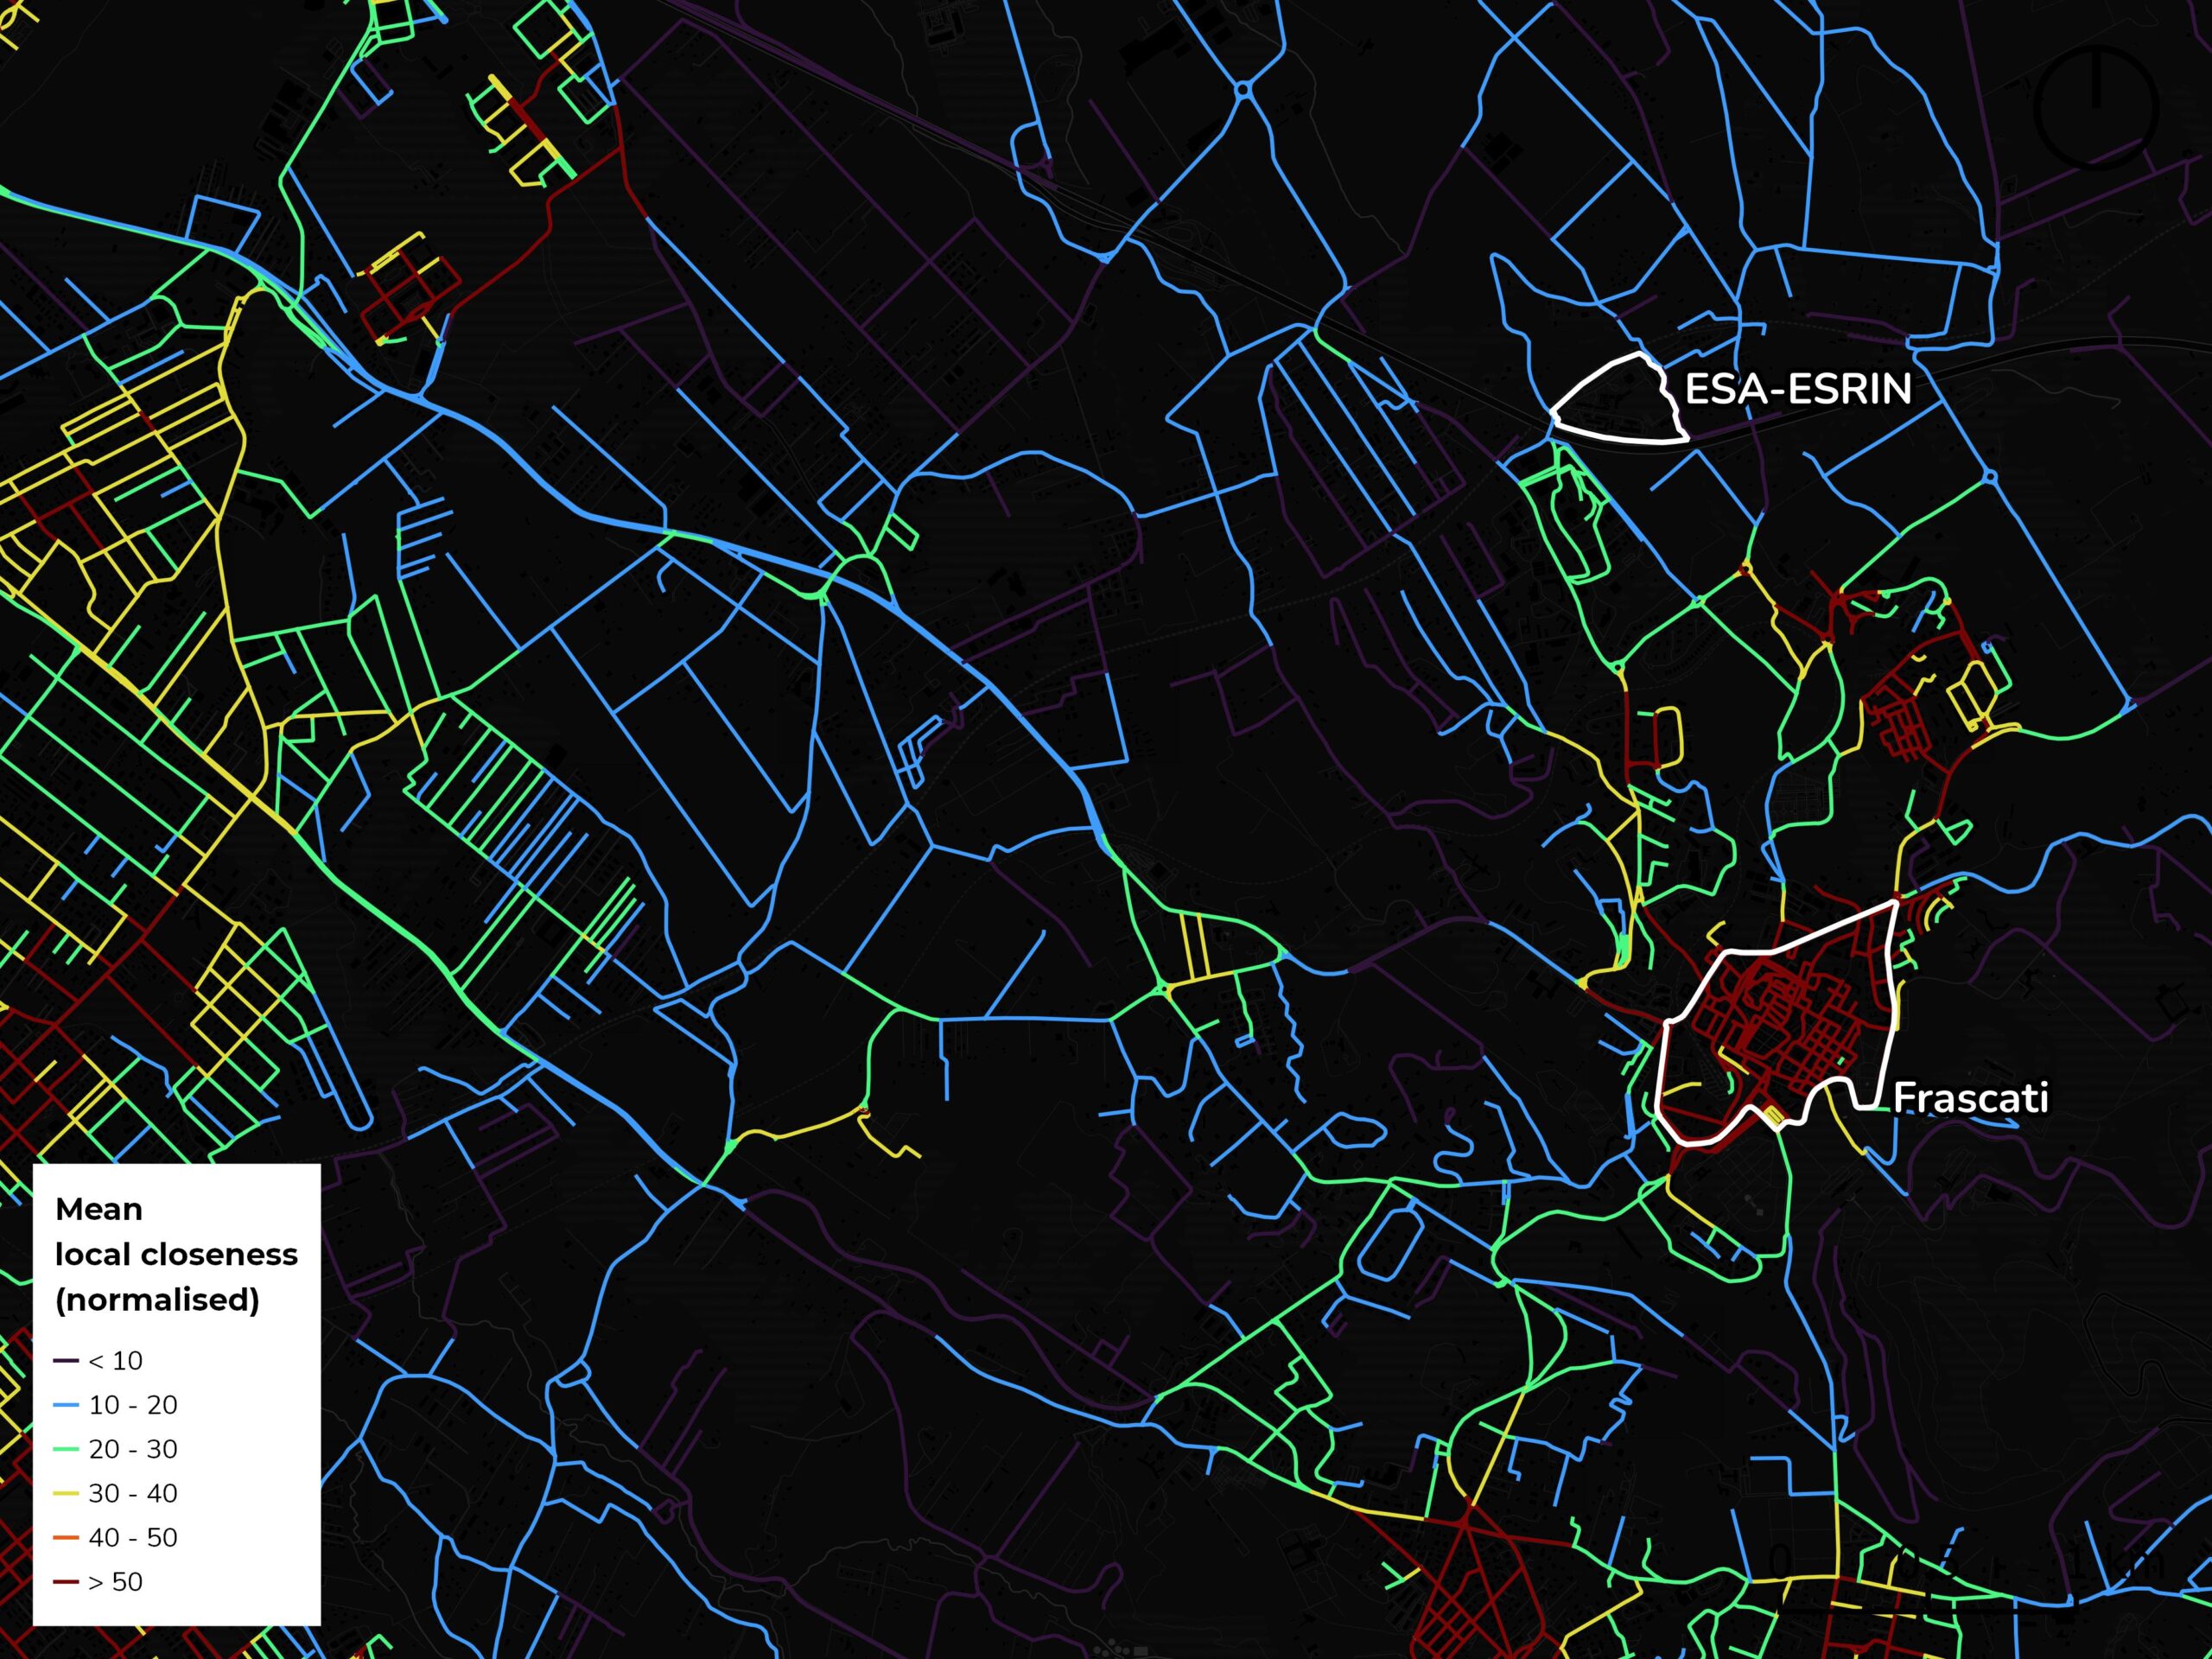
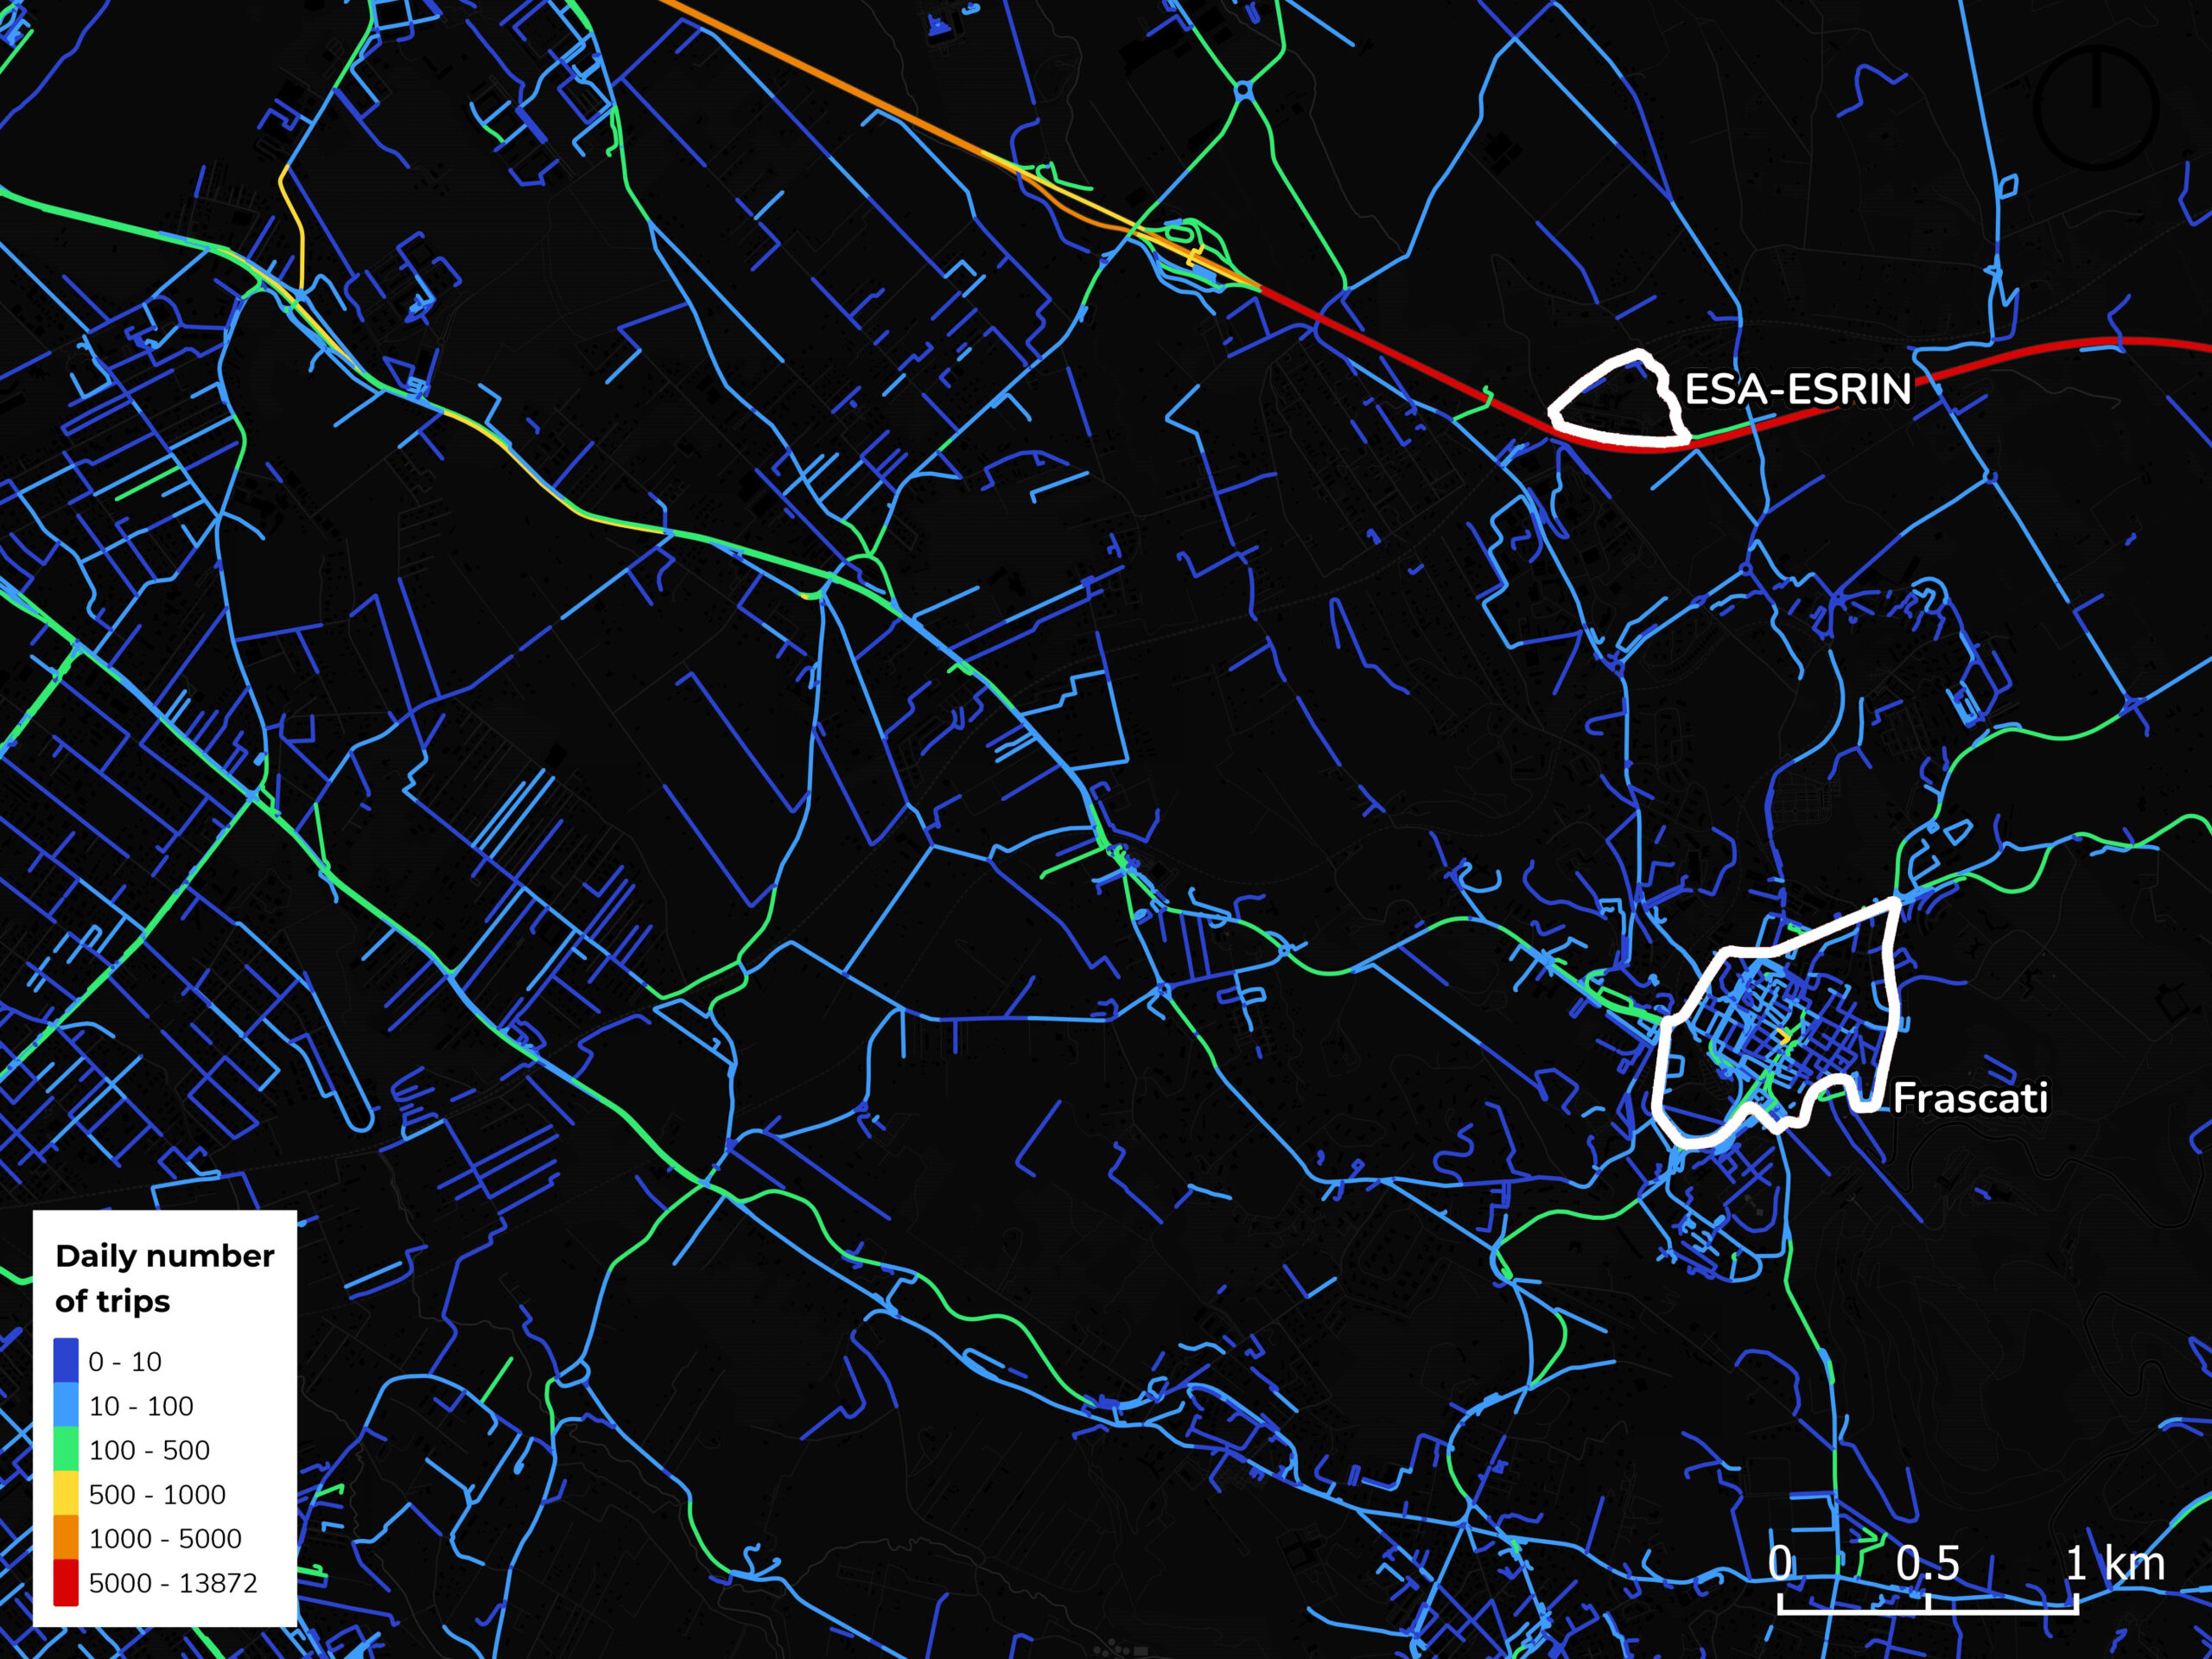
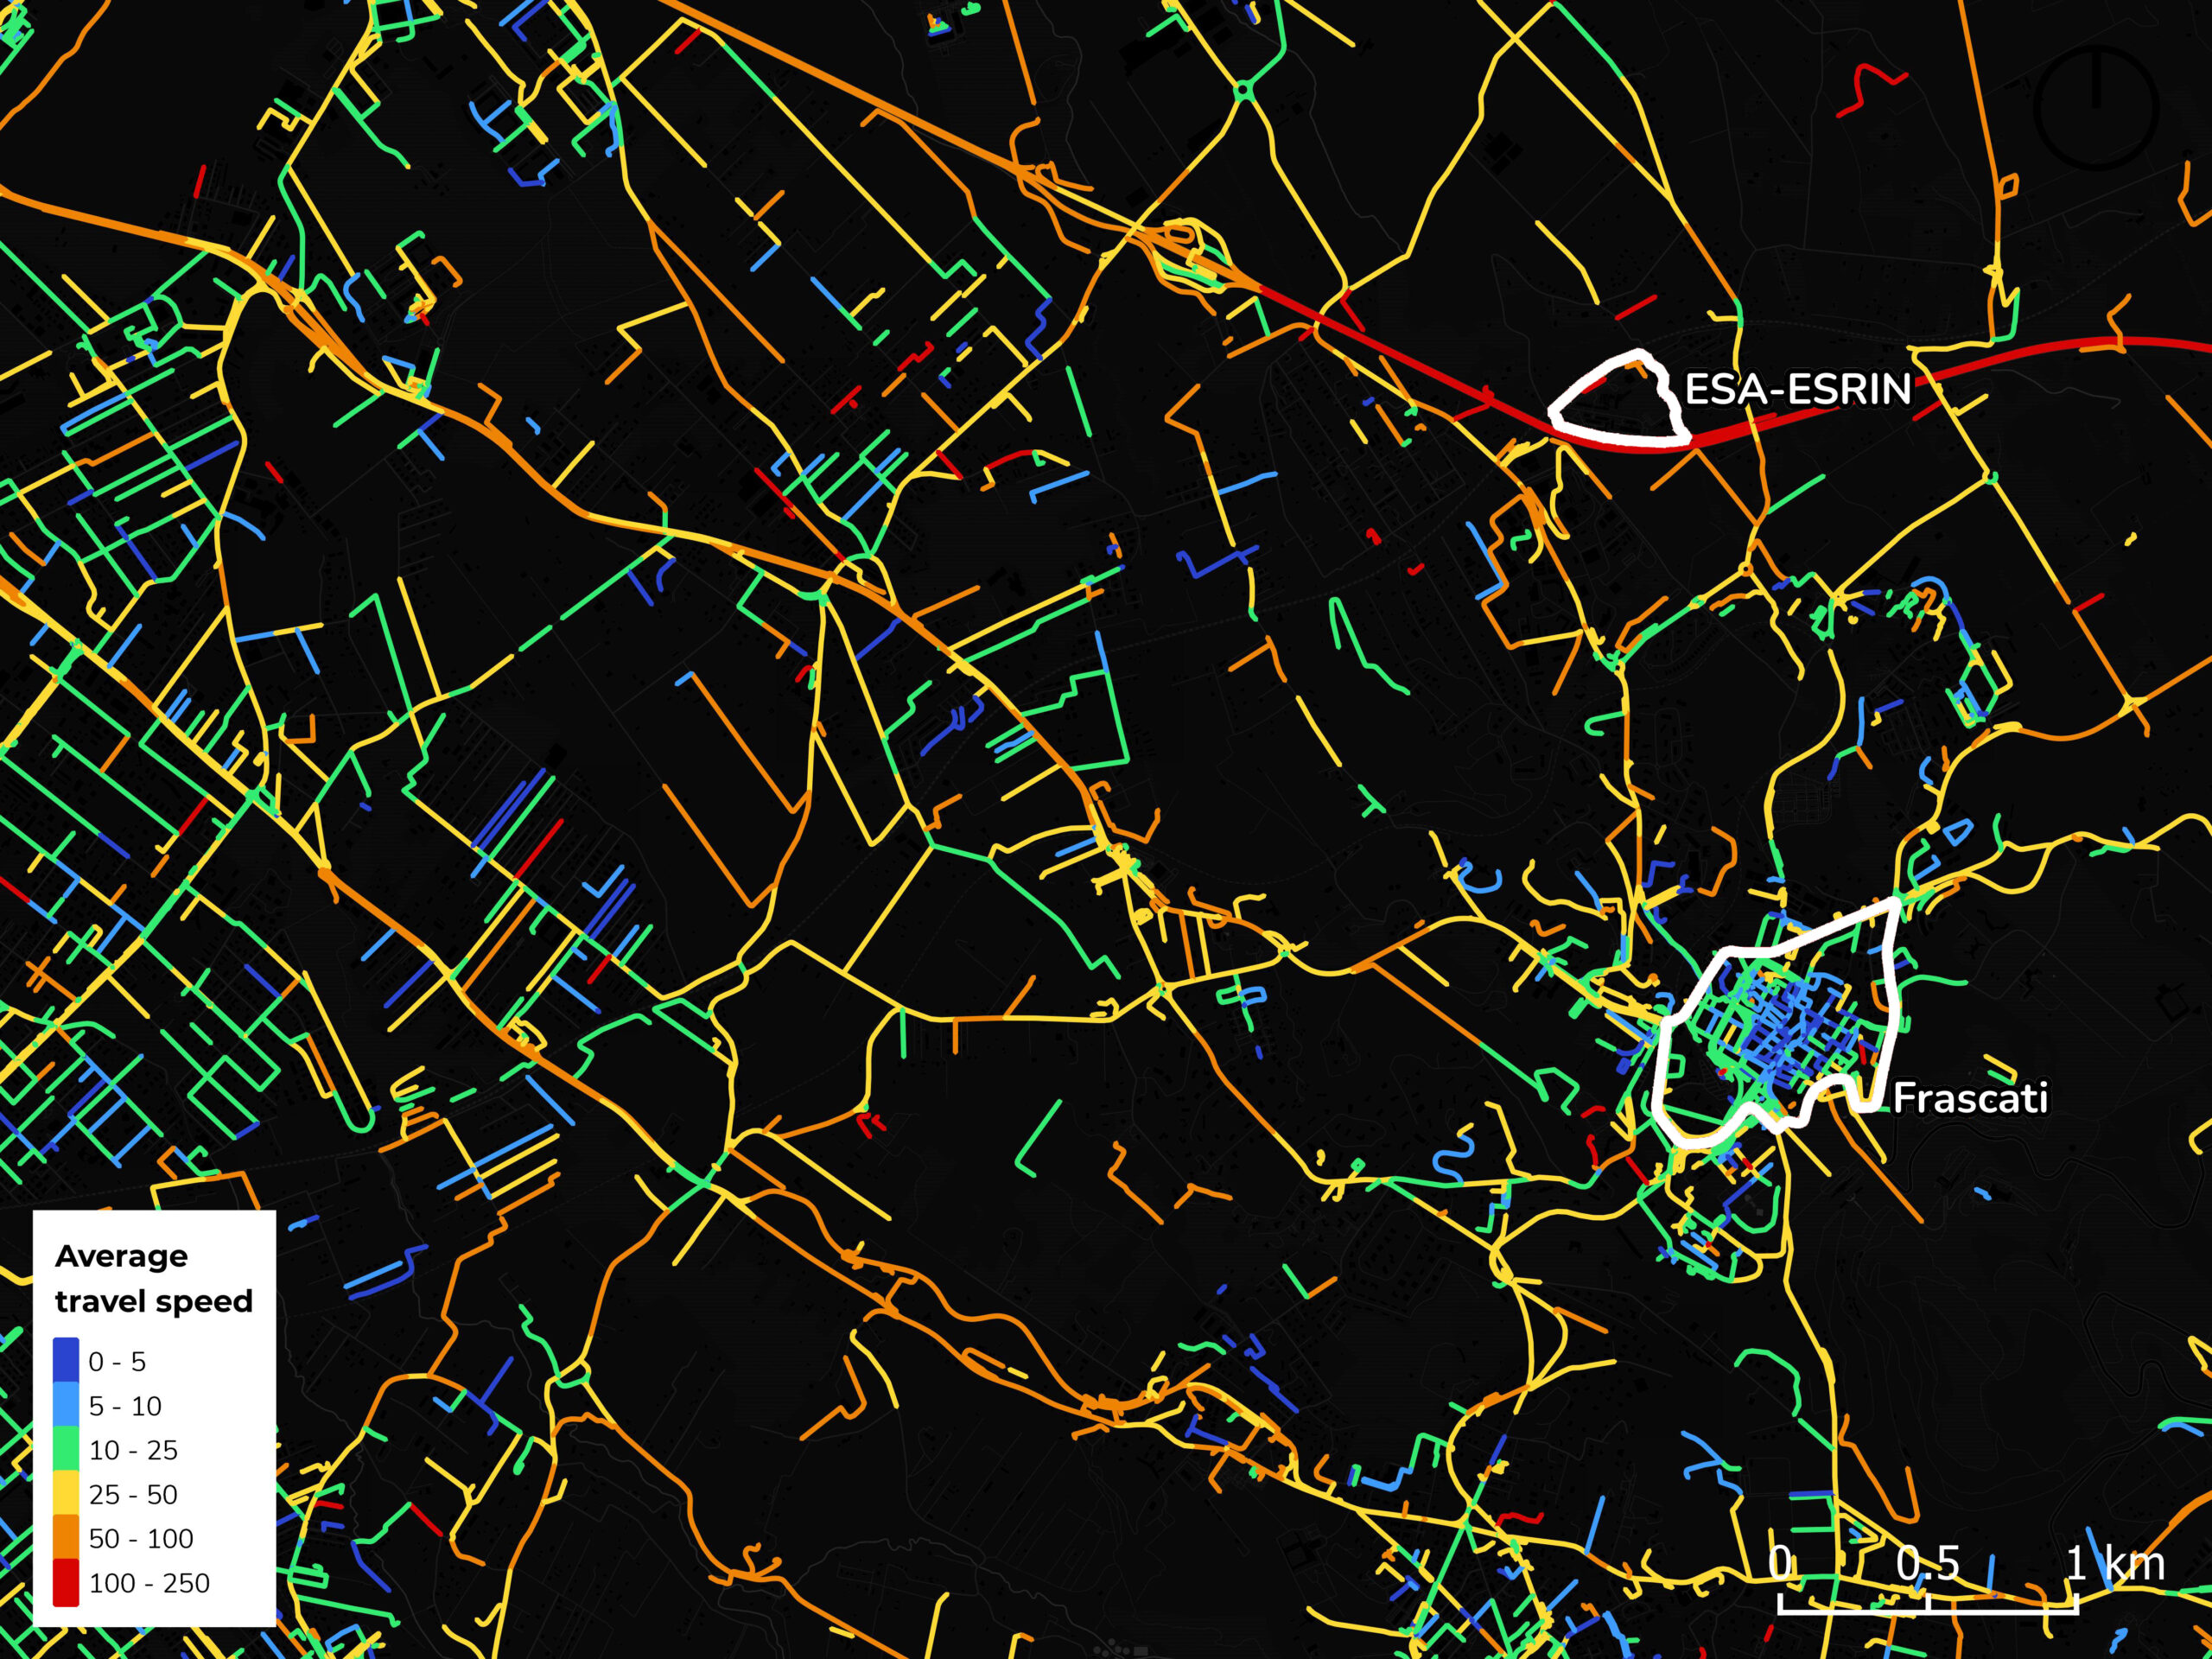
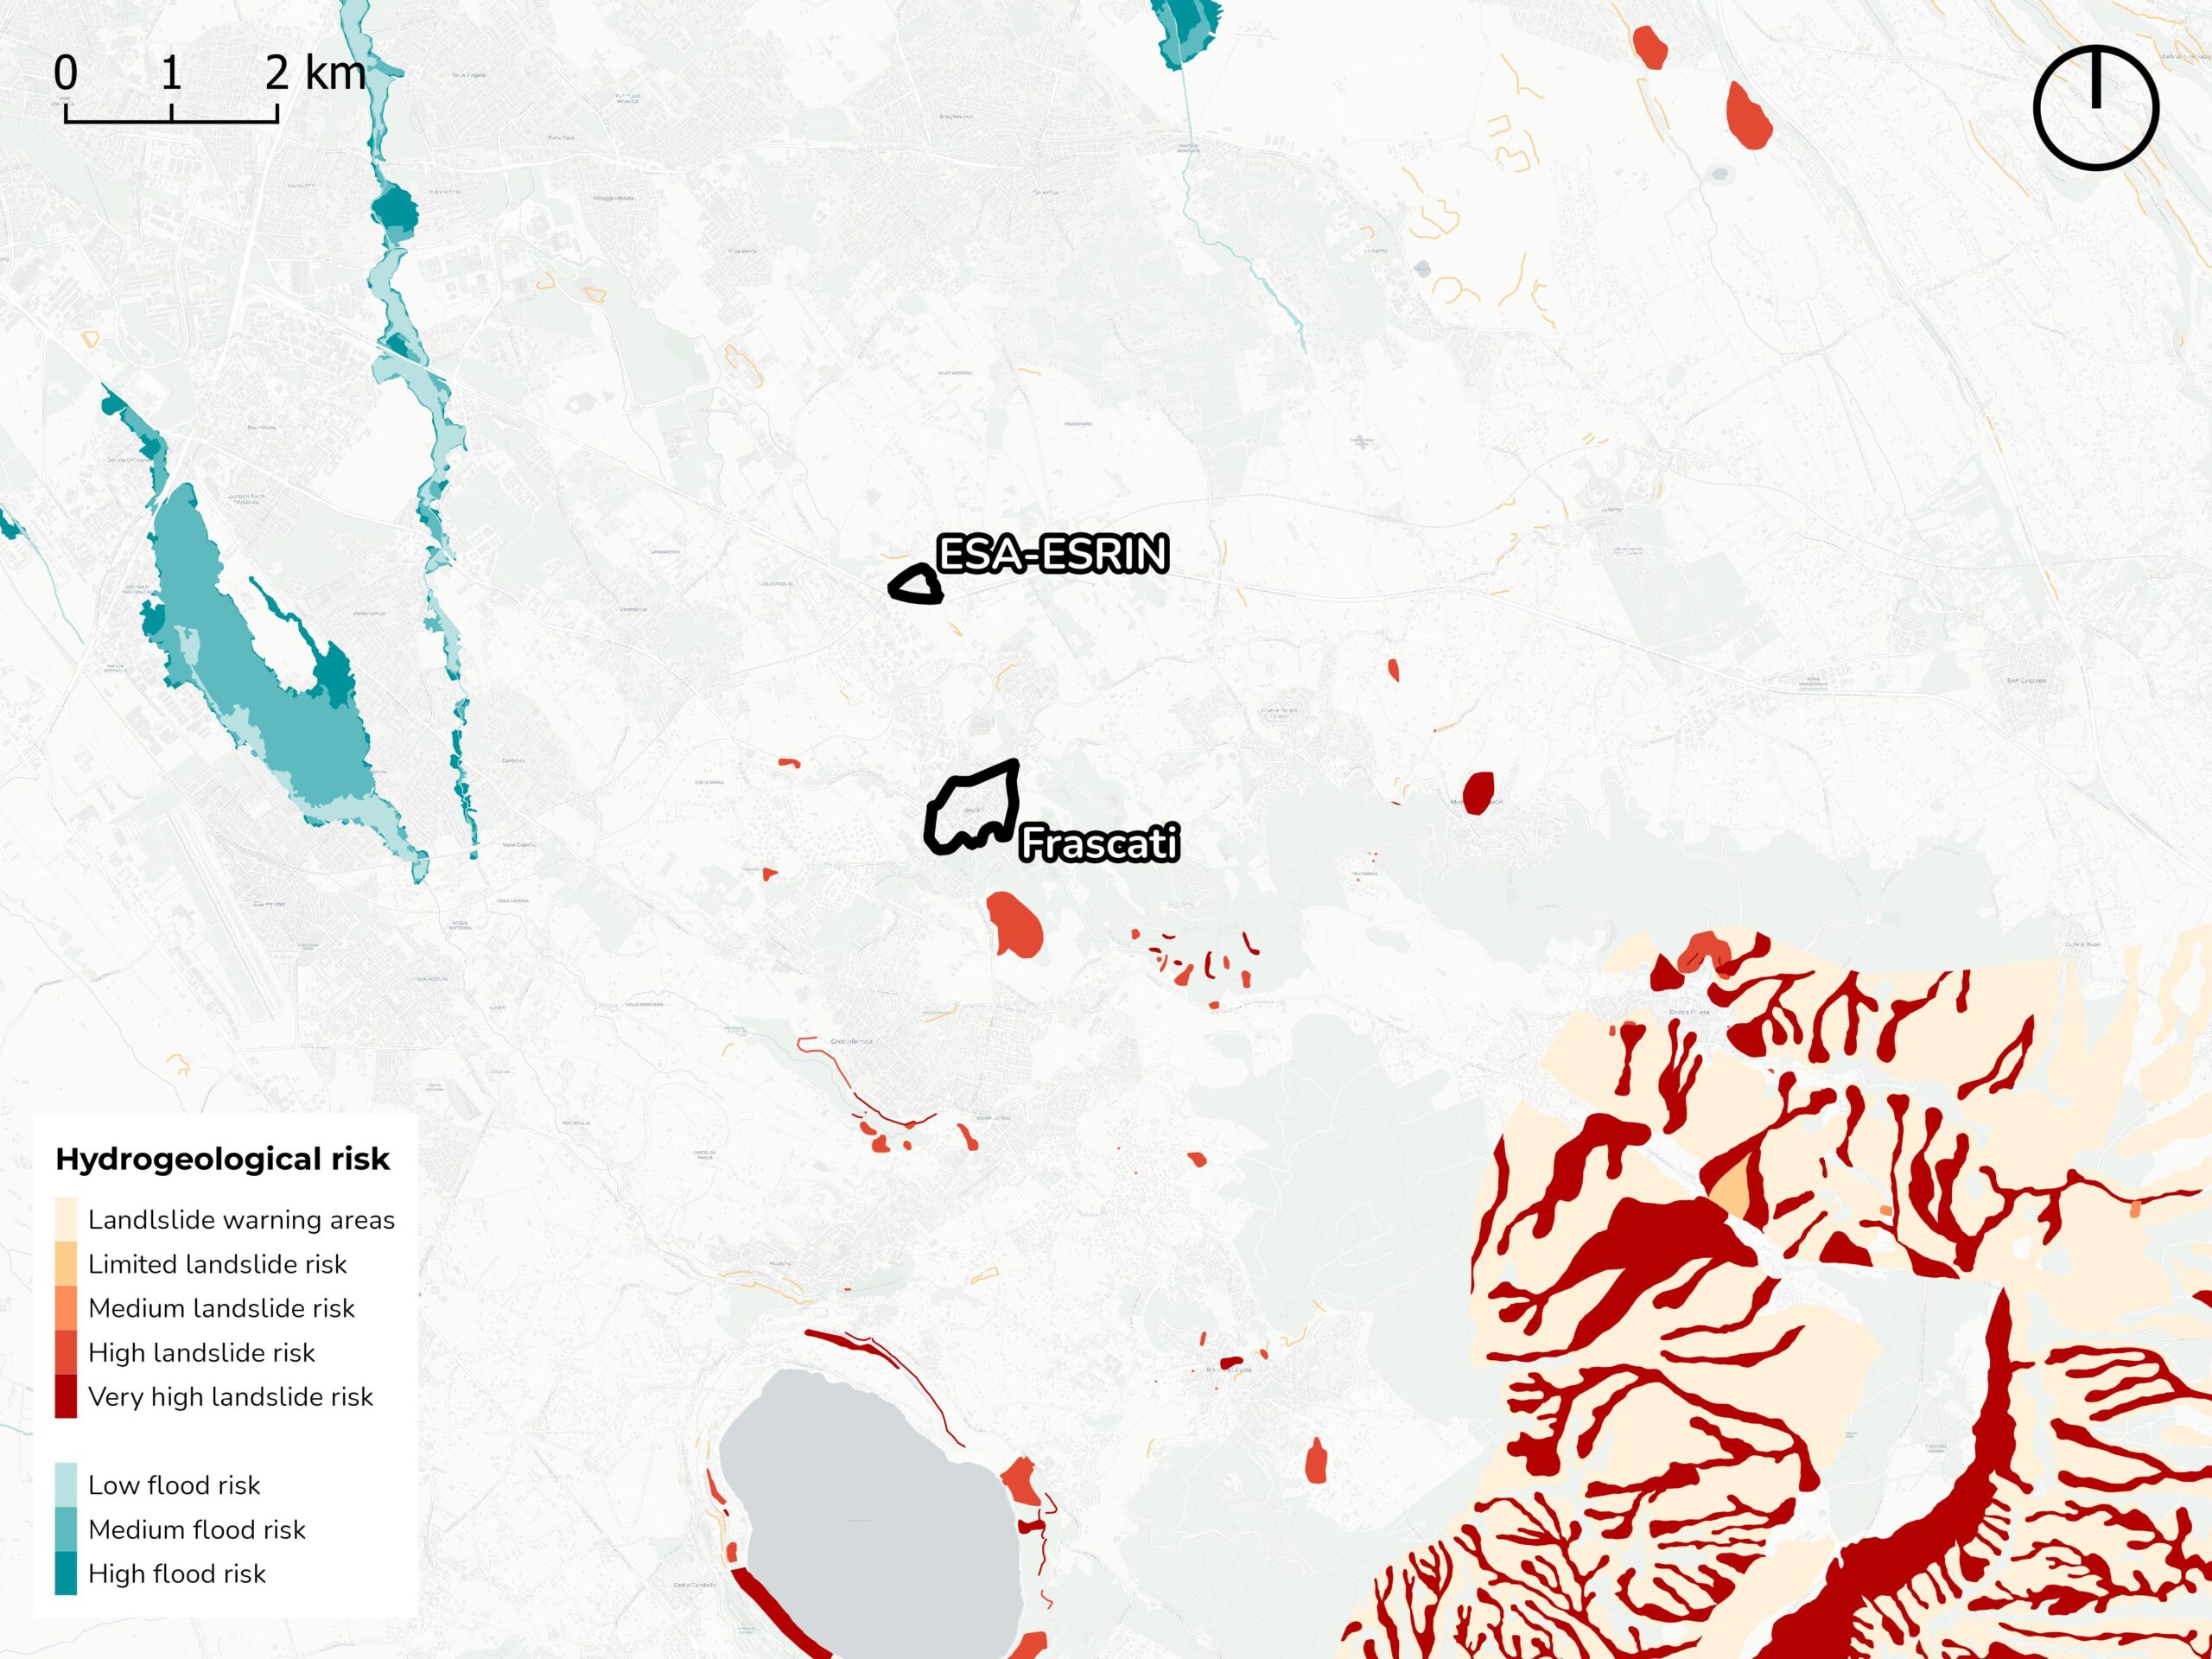
Figure 6: from top left to bottom right: a) floor area ratio defined as the ratio of a building’s total floor area to the area of its land parcel. Computed using momepy: b) mean building height expressed in number of storeys above ground. Computed using momepy, c) local closeness of streets evaluating the average distance between each street segment and every other street in the network within a radius of 800 m. Computed using momepy, d) daily number of trips derived from High-Frequency Location-Based data purchased for the year 2020 using mobilkit, e) average travel speed derived from High-Frequency Location-Based data purchased for the year 2020 using mobilkit, f) velocity Score (Biazzo et al. 2019) measures how fast it is possible to reach any point from any other point in the city from a given origin in multi-modal routing. Derived from General Transit Feed Specification data, g) sociality Score (Biazzo et al. 2019) measures the amount of population that it is possible to reach from any point in the city from a given origin in multi-modal routing. Derived from General Transit Feed Specification data, h) residential building sale price as gathered from multiple real estate agencies, i) Hidrogeological risk reporting flood and landslide risk area at different probability levels.
Combining data layers and generating scanarios
The effects of the COVID-19 lockdown on mobility and air quality
The data layers populating the DTUP have been used to evaluate the impact of lockdown measures adopted in April 2020 on people’s mobility habits and on air quality improvement.
To this end, we compared measurements of concentrations of atmospheric pollutantscollected by S5P and ground-level air monitoring stations of the regional environmental protection agency (ARPA)in the Lazio Region with GPS-derived location data tracking the movements of around 1 million users over a period of 1-year, from January 2020 to December 2020. In particular, we compared the monthly average concentration of atmospheric NO2 to variations in human mobility. This last is measured as number of trajectories passing in each road segment and their speed of travel relative to a baseline period (January 2020).
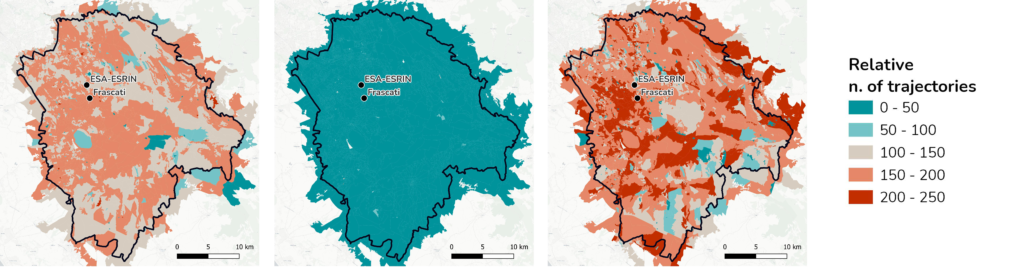
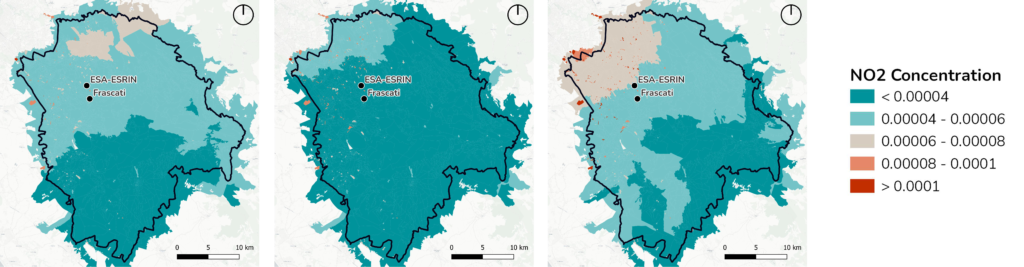
The series of maps in Figure x illustrate how by limiting movement, Covid-19 lockdown measures resulted in a significant (albeit temporary) drop in atmospheric NO2 concentration.
Figure 7: Density of trajectories (toprow) derived from HFLB data per census unit, and S5P NO2 concentration plus spatially extended in situ air quality information (bottom row) before, during, and after 2020’s COVID-19 lockdowns.
What-if scenario: flood impact assessment
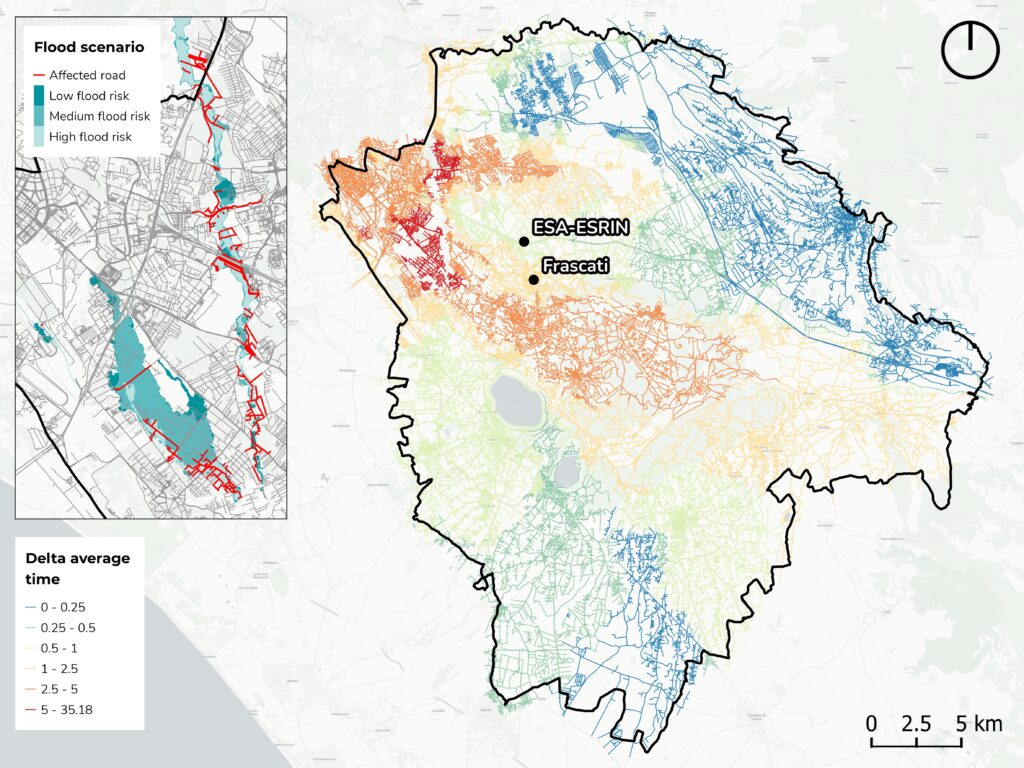
We combined hydrogeological risk data and mobility records to assess the impact of a flood event localized in Pericolosity 1 (P1) flood hazard zones (see Figure x, inset) on the accessibility of the road network in the region of interest.
We modeled interruptions to the road network in correspondence of affected areas and simulateed the redistribution of flows within the affected network over the wider area of interest. Relying on graph theory metrics we assessed the propagation of the impact of punctual failures on travel duration across the wider network.
Figure 8: The impact of modelled P1 flood event on the road network in terms of propagation of delays, expressed as the relative increase in travel time on the affected network compared to unperturbed state. Observed delays range from 0& (blue) to 35% (red) in most affected areas.
Digital Twin Web Platform & Mobile Application
To ensure for an easy and seamless access to the data, three complementary digital platforms were developed.
The first is a web visualisation platform for the exploration of the textured 3D model of the Colli Romani area via browser. This is also populated with many different data layers the user can switch on an off and query information specific to each feature.
The second is a virtual reality smartphone app tailored to Android smartphones and tablets, which features the same structure and functionalities as the web platform,
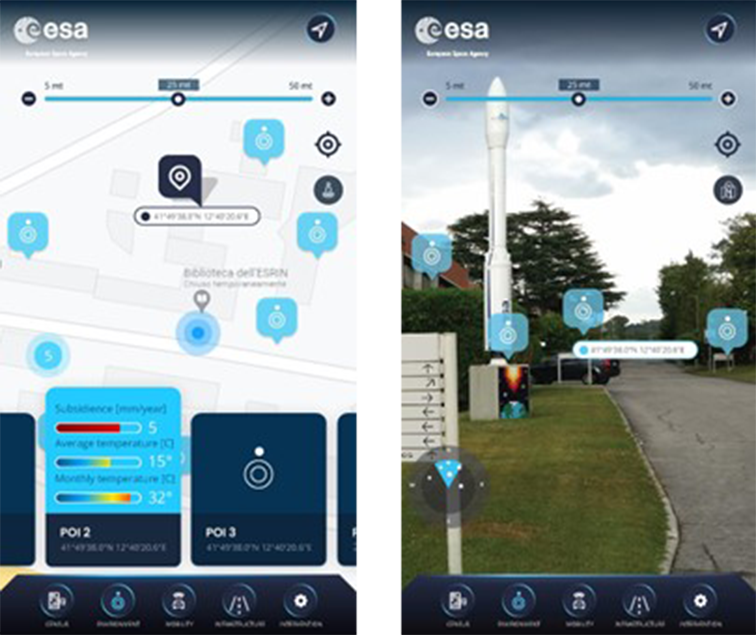
The third is an augmented reality smartphone app, this too compatible with Android smartphones and tablets, which supports data selection and query, map navigation and augmented reality exploration functionalities for a large number ofpoints of interest.
Figure 9: Digital Twin Web Platform front-end user interface
Figure 10: Virtual Reality (VR) Mobile Application
Figure 11: Augmented Reality (AR) Mobile Application
Conclusions
Urban Digital Twins make it possible to achieve an immersive view of physical assets, thanks to UAV, LIDAR, or street-view surveys, to evaluate their current performance from multiple point ov view, including transportation, mobility, real estate, climate, pollution etc., or to test their development potential, through “what if” scenarios.
The possibility of collecting all the territorial and environmental information in a single platform is an undoubted advantage at the planning level to better calibrate actions, to gather a more comprehensive understanding of territory and its setting and to drafting plans/programmes.
Mapping the relationship between urbanization and exposure to flood at a global scale between 1985 and 2015
We use cookies on our website to give you the most relevant experience by remembering your preferences and repeat visits. By clicking “Accept”, you consent to the use of all the cookies.
This website uses cookies to improve your experience while you navigate through the website. Out of these, the cookies that are categorized as necessary are stored on your browser as they are essential for the working of basic functionalities of the website. We also use third-party cookies that help us analyze and understand how you use this website. These cookies will be stored in your browser only with your consent. You also have the option to opt-out of these cookies. But opting out of some of these cookies may affect your browsing experience.
Necessary cookies are absolutely essential for the website to function properly. These cookies ensure basic functionalities and security features of the website, anonymously.
Cookie
Duration
Description
cookielawinfo-checbox-analytics
11 months
This cookie is set by GDPR Cookie Consent plugin. The cookie is used to store the user consent for the cookies in the category "Analytics".
cookielawinfo-checbox-functional
11 months
The cookie is set by GDPR cookie consent to record the user consent for the cookies in the category "Functional".
cookielawinfo-checbox-others
11 months
This cookie is set by GDPR Cookie Consent plugin. The cookie is used to store the user consent for the cookies in the category "Other.
cookielawinfo-checkbox-necessary
11 months
This cookie is set by GDPR Cookie Consent plugin. The cookies is used to store the user consent for the cookies in the category "Necessary".
cookielawinfo-checkbox-performance
11 months
This cookie is set by GDPR Cookie Consent plugin. The cookie is used to store the user consent for the cookies in the category "Performance".
viewed_cookie_policy
11 months
The cookie is set by the GDPR Cookie Consent plugin and is used to store whether or not user has consented to the use of cookies. It does not store any personal data.
Functional cookies help to perform certain functionalities like sharing the content of the website on social media platforms, collect feedbacks, and other third-party features.
Performance cookies are used to understand and analyze the key performance indexes of the website which helps in delivering a better user experience for the visitors.
Analytical cookies are used to understand how visitors interact with the website. These cookies help provide information on metrics the number of visitors, bounce rate, traffic source, etc.
Advertisement cookies are used to provide visitors with relevant ads and marketing campaigns. These cookies track visitors across websites and collect information to provide customized ads.